. 2009 Aug 15;81(16):6868-78.
doi: 10.1021/ac900881z.

Quantitative microplate-based respirometry with correction for oxygen diffusion

Affiliations
Free PMC article

Quantitative microplate-based respirometry with correction for oxygen diffusion

Akos A Gerencser et al. Anal Chem. .
Free PMC article

Abstract

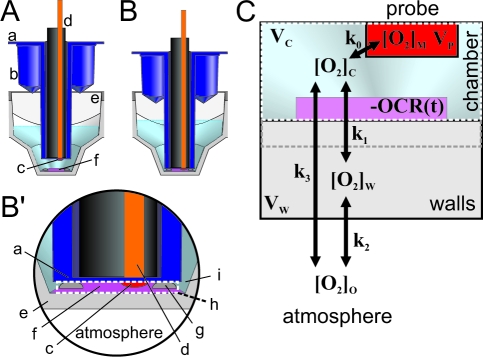
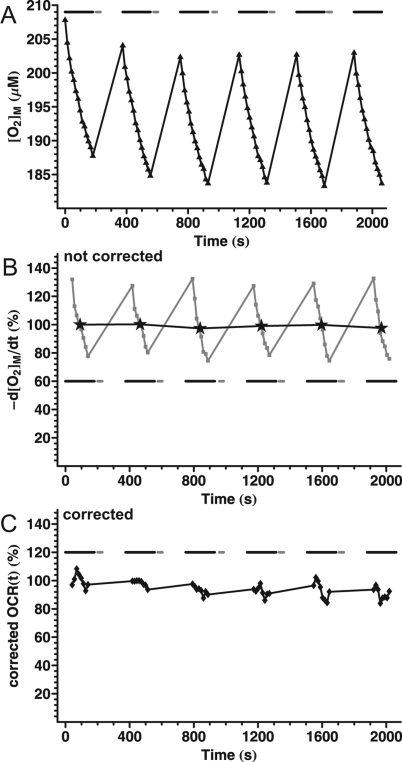
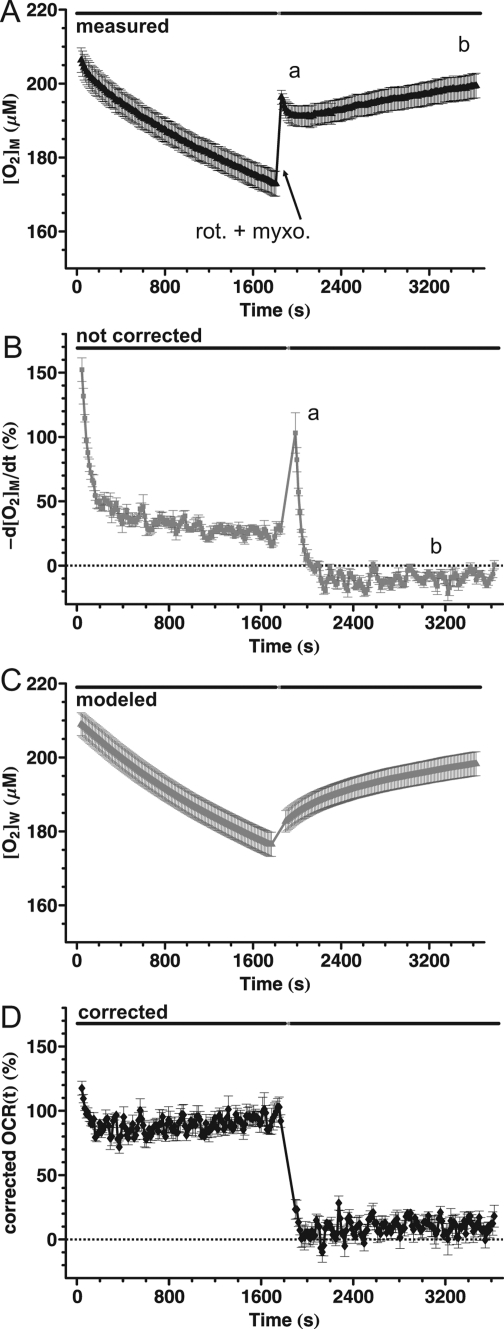
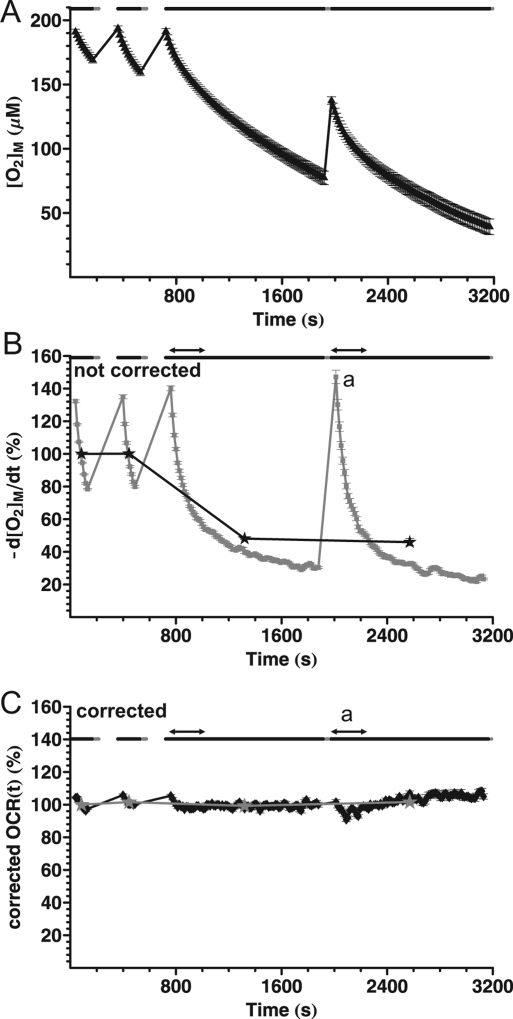
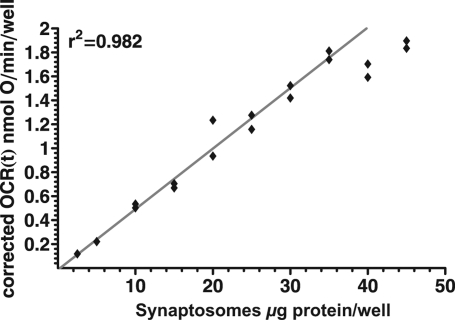
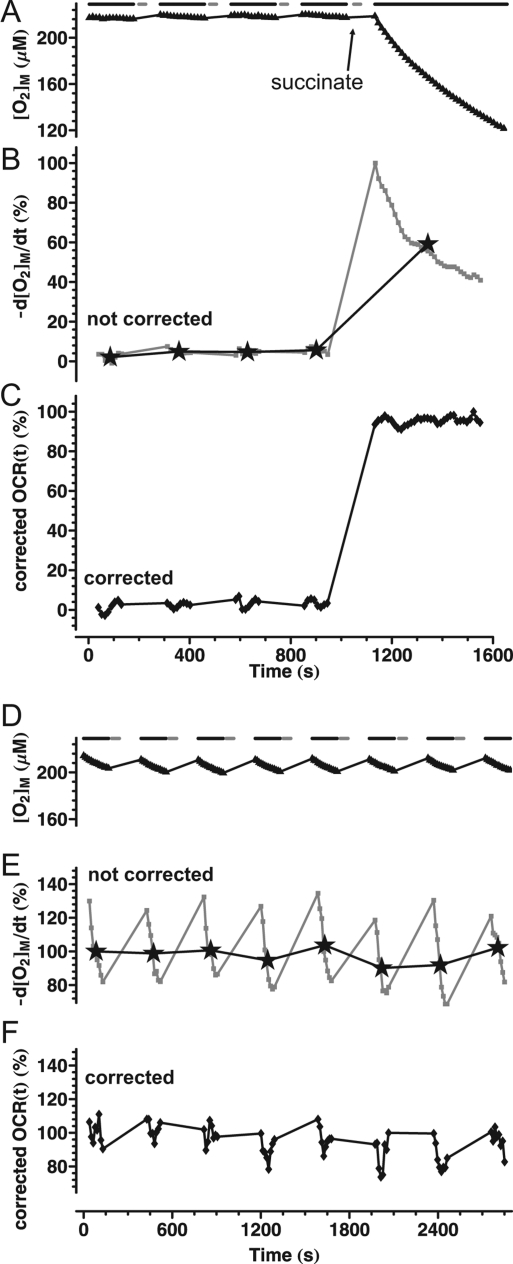
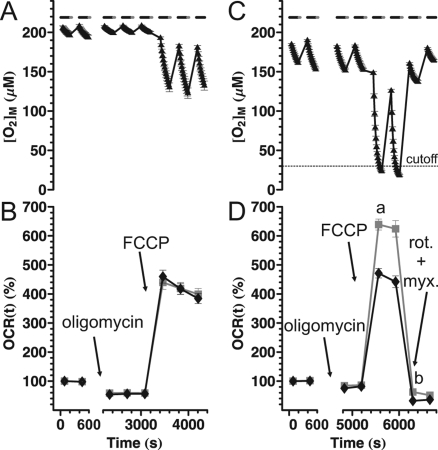
Respirometry using modified cell culture microplates offers an increase in throughput and a decrease in biological material required for each assay. Plate based respirometers are susceptible to a range of diffusion phenomena; as O(2) is consumed by the specimen, atmospheric O(2) leaks into the measurement volume. Oxygen also dissolves in and diffuses passively through the polystyrene commonly used as a microplate material. Consequently the walls of such respirometer chambers are not just permeable to O(2) but also store substantial amounts of gas. O(2) flux between the walls and the measurement volume biases the measured oxygen consumption rate depending on the actual [O(2)] gradient. We describe a compartment model-based correction algorithm to deconvolute the biological oxygen consumption rate from the measured [O(2)]. We optimize the algorithm to work with the Seahorse XF24 extracellular flux analyzer. The correction algorithm is biologically validated using mouse cortical synaptosomes and liver mitochondria attached to XF24 V7 cell culture microplates, and by comparison to classical Clark electrode oxygraph measurements. The algorithm increases the useful range of oxygen consumption rates, the temporal resolution, and durations of measurements. The algorithm is presented in a general format and is therefore applicable to other respirometer systems.


Figures

Figure 1
Figure 1
Seahorse XF24 V7 microplate chamber and the generalized compartment model for semiclosed chamber oxygraphs. (A and B) Well of the XF24 V7 microplate, with probe in up (A) and in measure (B and B’) positions. (a; blue) disposable cartridge consisting of the drug injection ports (b) and the O2 probe (c; red; the pH and optional CO2 sensors are not shown). (d) steel rod containing fiber optics for fluorescence data collection. (e; gray) one well of the flux plate with assay medium and the biological material (f; purple). (g) Bumps in the bottom of the well acting as spacers establishing the thickness (∼200 μm) of the entrapped volume denoted as “chamber” (h; dashed white outline). The entrapped volume is open from the sides, but slow diffusion rates limit O2 exchange with fluid spaces (i) around the rim of the tip of the sensor piston (a). (C) Compartment model of open or semiclosed oxygraphs. Color coding corresponds to (A and B). See details in text.
Figure 2
Figure 2
Basal respiration of cortical synaptosomes in Seahorse medium containing glucose plus pyruvate. (A). Fluorescence values from a representative well in a XF24 V7 microplate were converted to [O2] using eq 5 and F0 = 44000 as determined in a separate experiment by addition of Na-dithionite. Data points correspond to the measured [O2] ([O2]M) with a 13 s data acquisition interval within the measurement periods (3 min in length; black bars). Each measurement period was followed by mixing (30 s; gray bars) and a wait period. Data are from one well and represent >5 independent plates. (B) Noncorrected basal oxygen consumption rate of synaptosomes, as calculated by temporal differentiation of the [O2]M data from (A). Stars indicate mean oxygen consumption rate for each measurement period, normalized to the first data point. Gray squares show the temporally differentiated concentration data (noncorrected oxygen consumption rate trace). The first and last three data points were dropped in each measurement period due to the effect of kernel filtering with a width of seven points for differentiation. Note that the decay of the differentiated trace is simply the reflection of the decelerating decay of [O2] in (A). (C) Corrected basal oxygen consumption rate of synaptosomes, as calculated by the compartment model correction using the time constants in Table 1.
Figure 3
Figure 3
The behavior of noncorrected oxygen consumption rate suggests effects of O2 storage and diffusion. (A) Basal respiration of cortical synaptosomes in Seahorse medium containing glucose plus pyruvate was inhibited by addition of rotenone (20 nM) plus myxothiazol (2 μM) as indicated. Symbols represent [O2]M (determined as for Figure 2) with a 13 s data acquisition interval within 30 min measurement periods (black bars). The two measurement periods were separated by drug injection and mixing (20 s). Data are mean ± sem of n = 4 wells from a representative plate. Note (a) the decaying [O2]M after respiration was inhibited, which suggests that O2 diffuses into a previously depleted storage compartment, and (b) the increasing [O2]M in the entrapped chamber volume when mitochondria do not respire, which suggests O2 leakage from the atmosphere. (B) Noncorrected basal oxygen consumption rate of synaptosomes, calculated by temporal differentiation of the [O2]M data from (A). Note (a) initial high noncorrected oxygen consumption rate for minutes after respiratory inhibition; (b) negative noncorrected oxygen consumption rate. (C) [O2] in the walls of the chamber ([O2]W) as calculated by eq 13 of the compartment model correction using the time constants obtained below. (D) Corrected basal oxygen consumption rate of synaptosomes, calculated by the compartment model correction using the time constants in Table 1.
Figure 4
Figure 4
Experimental design for amplified wall storage effects and optimization of time constants. (A) Basal respiration of cortical synaptosomes in Seahorse medium containing glucose plus pyruvate. [O2] was determined as for Figure 2. Two 20 min measurements were taken following each other with only a short mixing period in between. Data are from a representative well from three independent experiments and 20 wells per experiment. (B) Noncorrected oxygen consumption rate corresponding to (A). Stars indicate mean oxygen consumption rate for each measurement period, normalized to the first data point. Note that while respiration is considered to be steady based on Figure 2B, the mean oxygen consumption rate in long measurement periods is underestimated. Gray diamonds show the temporally differentiated [O2] trace. Note (a) the higher initial noncorrected oxygen consumption rate, which supports the ideas that the walls are O2 depleted at this point, and O2 diffusion from the chamber into the walls contributes to the measured rates. Arrows indicate the range of variance calculation for the time constant optimization. (C) Corrected OCR(t) calculated by the compartment model correction using the time constants in Table 1. Data are mean ± sem of n = 20 wells from a representative of three independent plates.
Figure 5
Figure 5
Linearity of corrected OCR(t). Between 2.5 and 45 μg synaptosome protein/well (Bradford assay) were spun down into XF24 V7 microplates, and basal respiration was measured in Seahorse medium containing glucose plus pyruvate. The corrected oxygen consumption rate was calculated by the compartment model correction using the optimized rate constants given in Table 1 for polystyrene plates. Absolute values of respiration are shown using the value of VC = 22.7 μL obtained below. Linear regression was performed for the 2.5−35 μg/well concentration range. Data points correspond to individual wells in a single microplate representative of three experiments.
Figure 6
Figure 6
Noncorrected and corrected oxygen consumption rates recorded in plate-attached mitochondria and in cultured cortical neurons. (A−C) Mouse liver mitochondria were spun down into XF24 V7 microplates at 2.5 μg protein/well and preincubated with FCCP (0.5 μM), rotenone (2 μM) and cytochrome c (10 μM). Respiration was started by the addition of succinate (10 mM) as indicated. Data are from a representative well of three independent microplates. (D−F) Rat cortical cultures were plated into XF24 V7 microplates at 105 cells/well and grown for 12 d. Basal respiration was measured in Seahorse medium containing 15 mM glucose. Data shown are from a representative well from >5 independent plates. (A and D) [O2]M as calculated by eq 5 and F0 = 44 000. Data points correspond to the 13 s data acquisition intervals within the measurement periods (black bars). Each measurement period was followed by mixing (30 s; gray bars) and a wait period as indicated. (B and E) Gray squares indicate noncorrected oxygen consumption rate calculated as −d[O2]M/dt, stars mark the mean noncorrected oxygen consumption rate for each acquisition period. (C and F) Corrected OCR(t).
Figure 7
Figure 7
The compartment model correction avoids artifacts caused by O2 depletion in the chamber and in the walls. Basal respiration of cortical synaptosomes in Seahorse medium containing glucose plus pyruvate was recorded, followed by addition of oligomycin (2 μg/mL), FCCP (4 μM in the presence of BSA) and in (C and D) rotenone (2 μM) plus myxothiazol (2 μM), as indicated. (A and B) The experiment was designed according to the manufacturer’s recommended ideal conditions, not allowing [O2]M to deplete by more than 50 mmHg. Data points show the mean ± sem of values from 11 wells from four independent plates. (C and D) Double density plating of synaptosomes resulted in oxygen depletion during uncoupled respiration. Data points show the mean ± sem of values pooled from 55 wells from three independent plates. (B and D) Gray squares, noncorrected oxygen consumption rate calculated as mean −d[O2]M/dt for each measurement cycle; black diamonds, mean corrected OCR(t) calculated using the rate constants given in Table 1 for polystyrene plates. Note that in ‘ideal conditions’ (B) noncorrected and corrected relative oxygen consumption rates overlap, but in (D) the noncorrected values substantially deviate from (A) or from the corrected OCR(t) (black diamonds). The noncorrected rates are overestimated because of (a) rejecting data points corresponding to very low [O2] and (b) O2 depletion in the walls.
Figure 8
Figure 8
Plate-attached synaptosomes and mitochondria distribute evenly on the bottom of the microplate wells. (A) Cortical synaptosomes plated at 10 μg protein/well or (B) isolated liver mitochondria plated at 2.5 μg protein/well were stained with Mitotracker Red, and the bottom of the well was imaged with fluorescence microscopy. (a) The round structures are the spacers (Figure 1A and B (g)) which set the height of the chamber.

References

    1. Wu M.; Neilson A.; Swift A. L.; Moran R.; Tamagnine J.; Parslow D.; Armistead S.; Lemire K.; Orrell J.; Teich J.; Chomicz S.; Ferrick D. A. Am. J. Physiol. Cell Physiol. 2007, 292, C125–C136. - PubMed
    1. O’Riordan T. C.; Zhdanov A. V.; Ponomarev G. V.; Papkovsky D. B. Anal. Chem. 2007, 79, 9414–19. - PubMed
    1. Choi S. W.; Gerencser A. A.; Nicholls D. G. J Neurochem. 2009, 109, 1179–91. - PMC - PubMed
    1. Dykens J. A.; Jamieson J. D.; Marroquin L. D.; Nadanaciva S.; Xu J. J.; Dunn M. C.; Smith A. R.; Will Y. Toxicol. Sci. 2008, 103, 335–45. - PubMed
    1. Wang B.; Ogilby P. R. Can. J. Chem. 1995, 73, 1831–40.

Publication types