. 2009 Jun 26:6:12.
doi: 10.1186/1742-9994-6-12.

Phylogenetic support values are not necessarily informative: the case of the Serialia hypothesis (a mollusk phylogeny)

Affiliations

Phylogenetic support values are not necessarily informative: the case of the Serialia hypothesis (a mollusk phylogeny)

J Wolfgang Wägele et al. Front Zool. .

Abstract

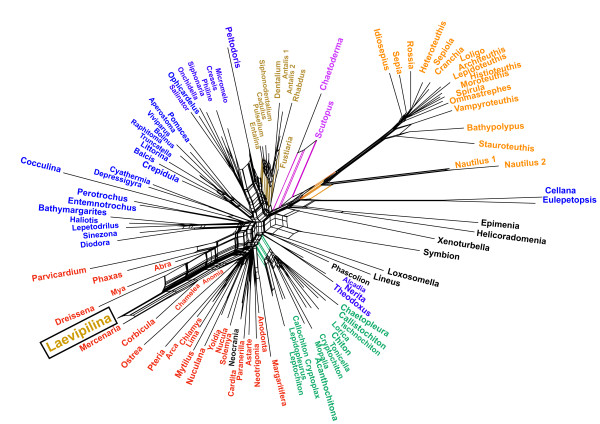
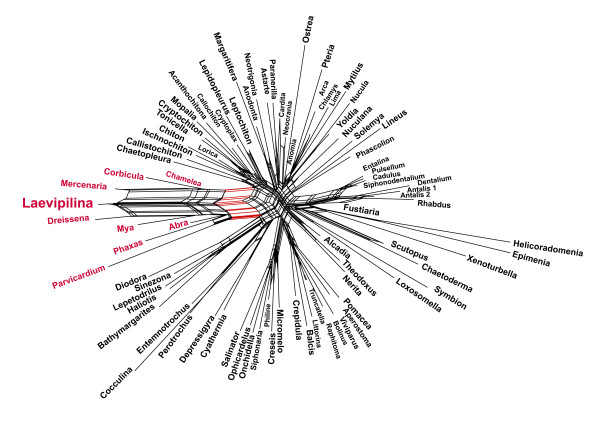
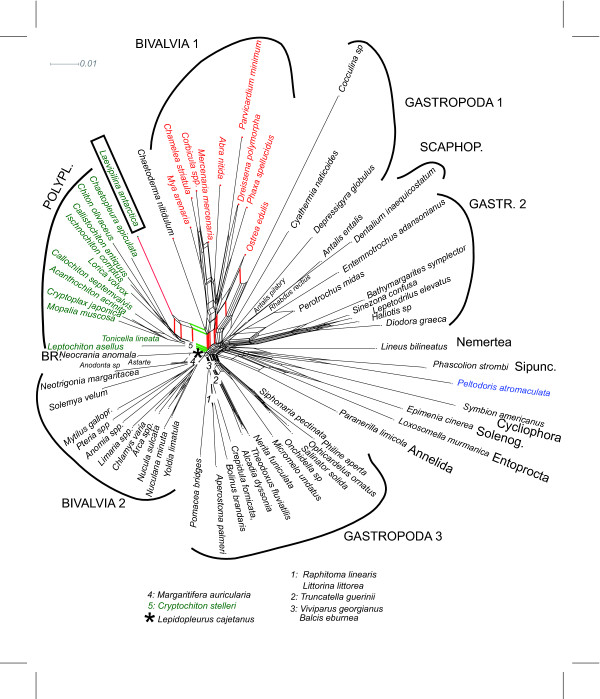
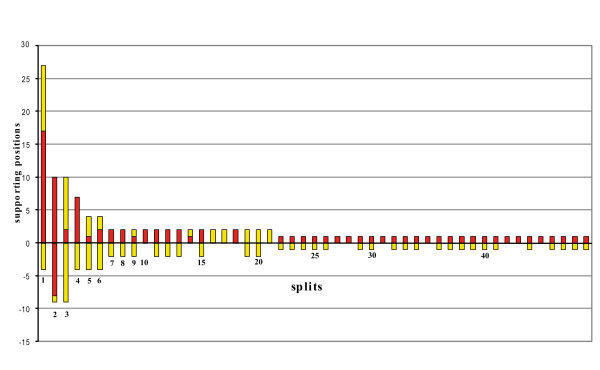
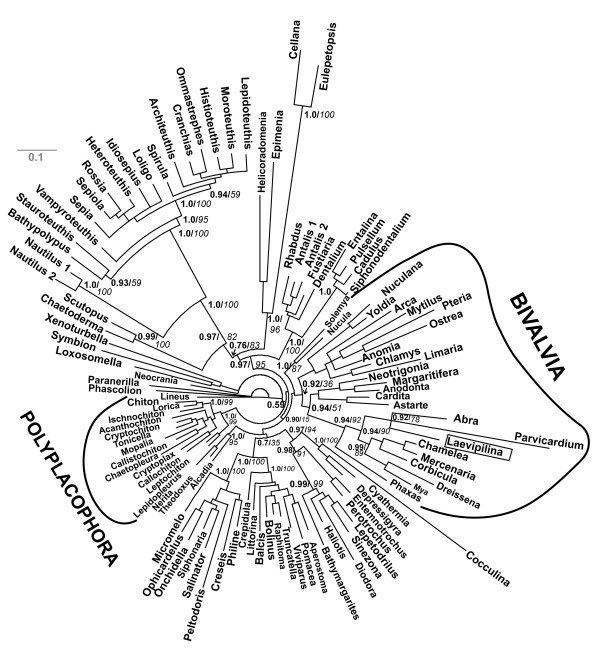
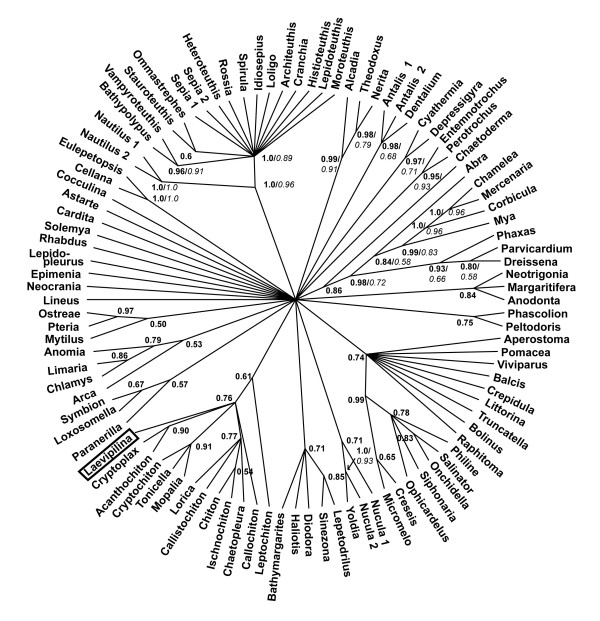
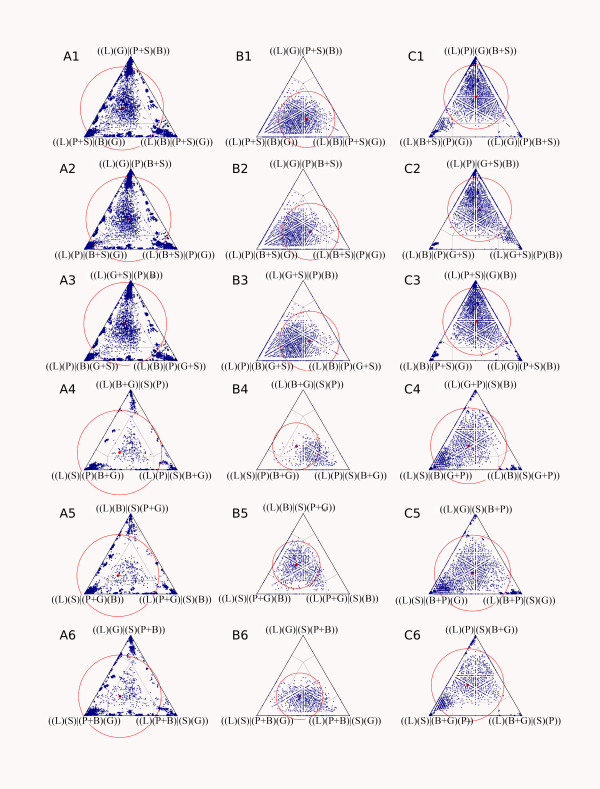
Background: Molecular phylogenies are being published increasingly and many biologists rely on the most recent topologies. However, different phylogenetic trees often contain conflicting results and contradict significant background data. Not knowing how reliable traditional knowledge is, a crucial question concerns the quality of newly produced molecular data. The information content of DNA alignments is rarely discussed, as quality statements are mostly restricted to the statistical support of clades. Here we present a case study of a recently published mollusk phylogeny that contains surprising groupings, based on five genes and 108 species, and we apply new or rarely used tools for the analysis of the information content of alignments and for the filtering of noise (masking of random-like alignment regions, split decomposition, phylogenetic networks, quartet mapping).

Results: The data are very fragmentary and contain contaminations. We show that that signal-like patterns in the data set are conflicting and partly not distinct and that the reported strong support for a "rather surprising result" (monoplacophorans and chitons form a monophylum Serialia) does not exist at the level of primary homologies. Split-decomposition, quartet mapping and neighbornet analyses reveal conflicting nucleotide patterns and lack of distinct phylogenetic signal for the deeper phylogeny of mollusks.

Conclusion: Even though currently a majority of molecular phylogenies are being justified with reference to the 'statistical' support of clades in tree topologies, this confidence seems to be unfounded. Contradictions between phylogenies based on different analyses are already a strong indication of unnoticed pitfalls. The use of tree-independent tools for exploratory analyses of data quality is highly recommended. Concerning the new mollusk phylogeny more convincing evidence is needed.


Figures

Figure 1
Figure 1
Neighbornet graph estimated from p-distances with SplitsTree and using the complete alignment from Giribet et al. (2006). Color code: Cephalopods are shown in orange, Caudofoveata mauve, Scaphopoda brown, Gastropoda blue, Polyplacophora green. Laevilipilina is nested within a subclade of the Bivalvia (red). Note long branches leading to cephalopods and to the gastropods Cellana and Eulepetopsis, which together form a weak clade probably supported by parallel substitutions. Polyphyly of gastropods and lack of distinct treeness indicates that, in this alignment, there is little conserved phylogenetic signal which is stronger than noise.
Figure 2
Figure 2
Neighbornet graph estimated from p-distances with SplitsTree and using the complete alignment from Giribeet et al. (2006) as in Figure 1, but without long-branch taxa (cephalopods, Cellana, Eulepetopsis, Peltodoris). Neither Bivalvia, nor Gastropoda are monophyletic. The Serialia are not supported.
Figure 3
Figure 3
Neighbornet graph for the 28S portion of the original alignment, the region for which data of Laevipilina is available. A set of short parallel edges supports a split that separates Laevipilina and most Polyplacophora (green), but a similar split unites Laevipilina with Bivalvia (red). The alignment does not contain a distinct nucleotide pattern supporting the Serialia.
Figure 4
Figure 4
Spectrum of split-supporting positions as estimated with SAMS. Column height represents the number of clade-supporting positions, i.e. putative primary homologies. Column parts above the y axis represent the best supported of the two groups of a split, the part below the axis corresponds to the second group. Red: asymmetrical positions (conserved character state only in functional ingroup); yellow: noisy positions (more than one character state in functional in- and outgroup; see Wägele and Rödding 1998a, b). The first ten columns represent the best supported splits and contain the following groupings: 1: Cellana sp.+ Eulepetopsis vitrea; 2: Coleoida; 3 Coleoida + Creseis sp; 4: Nautilus pompilius + Nautilus scrobiculatus; 5: Cephalopoda; 6: Cephalopoda + Creseis sp.; 7: Paranerilla limicola + Chaetoderma nitidulum; 8: Chamelea striatula + Corbicula spp + Mercenaria mercenaria; 9: Cellana sp.+ Eulepetopsis vitrea + Coleoida; 10: Cellana sp. + Eulepetopsis vitrea + Creseis sp. + Laevipilina antarctica. No split was detected that unites Laevipilina and Polyplacophora.
Figure 5
Figure 5
Bayesian analysis of original alignment (Giribet et al. 2006) after masking of random-like alignment regions with ALISCORE. .Monophyly of Bivalvia is supported except for the inclusion of Laevipilina in this clade (compare also with Figs. 1, 2, 3)
Figure 6
Figure 6
Bayesian analysis of the realigned 28Sr RNA partition purified with ALISCORE. Support for Serialia exists, but is negligible.
Figure 7
Figure 7
Visualizing phylogenetic structure of alignments via quartet mapping (Nieselt-Struwe and von Haeseler, 2001). Dots in a corner of a triangle represent high support for only one of the three topologies that can be constructed for a quartet of taxa. Dots in the centre represent a star-like topology, and the rest of the triangle stands for intermediate situations. Red circles indicate placement of the mean fraction of points. In all cases the majority of quartets are near the star-tree region, indicating little or no phylogenetic signal. The studied combinations are: A1–6: Original alignment of Giribet et al. (2006) with all characters. B1–6: Same alignment after exclusion of columns with gaps or missing data. C1–6: Same alignment after masking with the ALISCORE approach. For each alignment, the association of Laevipilina with all six possible variants of pairs of higher mollusc taxa were examined (see text). B = Bivalvia, G = Gastropoda, L = Laevipilina, P = Polyplacophora, S = Scaphopoda.

References

    1. Lento GM, Hickson E, Chambers GK, Penny D. Use of Spectral Analysis to Test Hypotheses on the Origin of Pinnipeds. Mol Biol Evol. 1995;12:28–52. - PubMed
    1. Philipps MJ, Delsuc F, Penny D. Genome-scale phylogeny and the detection of systematic biases. Mol Biol Evol. 2004;21:1455–1458. - PubMed
    1. Wägele JW, Mayer C. Visualizing differences in phylogenetic information content of alignments and distinction of three classes of long-branch effects. BMC Evol Biol . 2007;7:147. - PMC - PubMed
    1. Giribet G, Okusu A, Lindgren AR, Huff SW, Schrödl M, Nishiguchi MK. Evidence for a clade composed of molluscs with serially repeated structures: monoplacophorans are related to chitons. Proc Natl Acad Sci USA. 2006;103:7723–7728. - PMC - PubMed
    1. Wheeler W. Optimization alignment: the end of multiple sequence alignment in phylogenetics? Cladistics. 1996;12:1–9.

LinkOut - more resources