. 2009 Jun 25;62(6):850-61.
doi: 10.1016/j.neuron.2009.05.022.

Odor representations in olfactory cortex: "sparse" coding, global inhibition, and oscillations

Affiliations

Odor representations in olfactory cortex: "sparse" coding, global inhibition, and oscillations

Cindy Poo et al. Neuron. .

Abstract

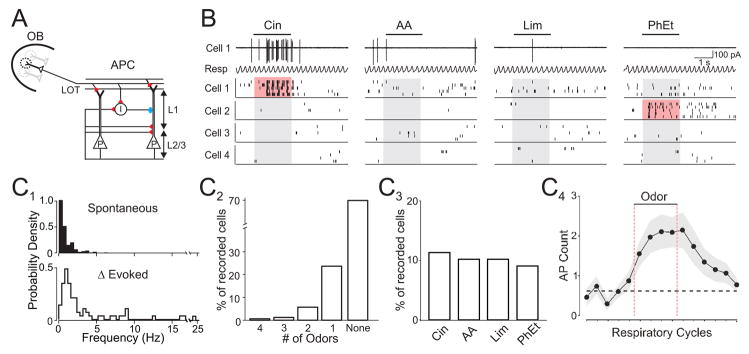
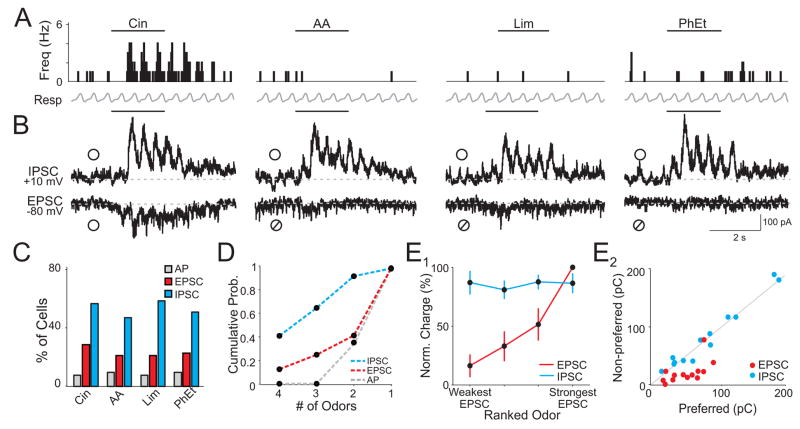
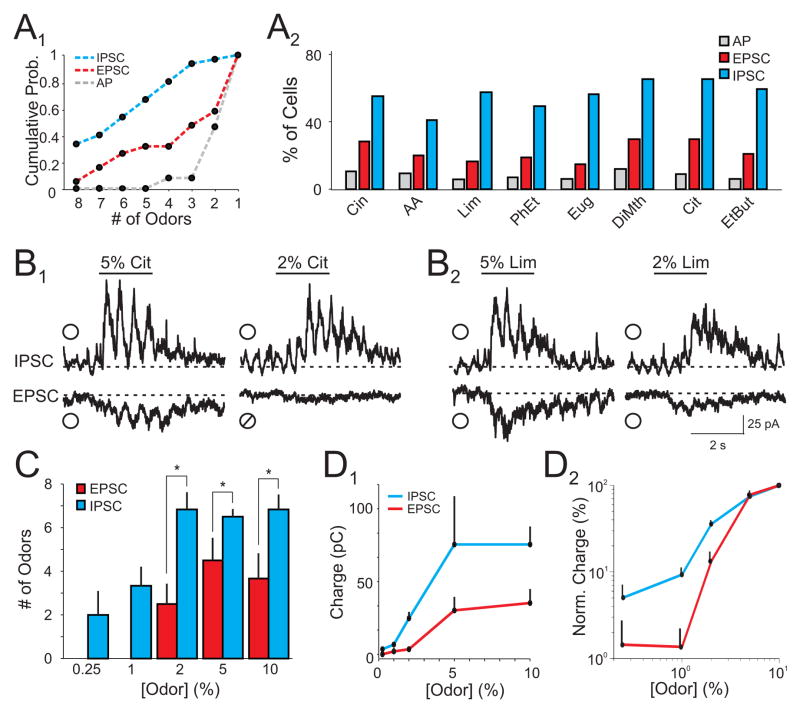
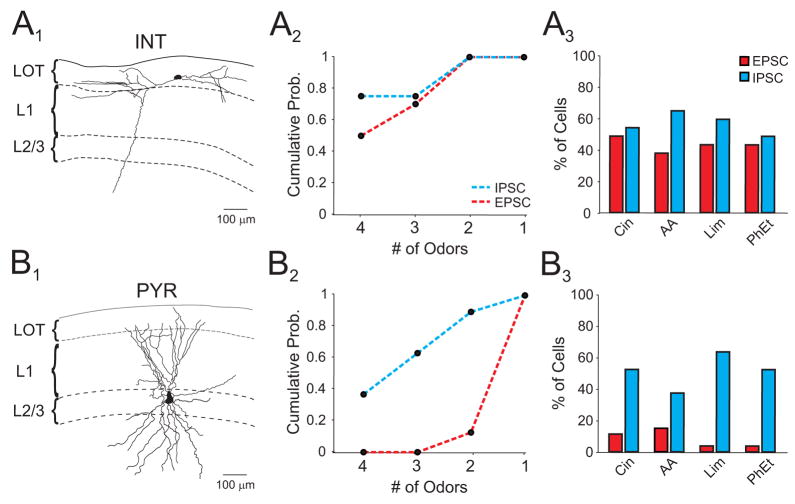
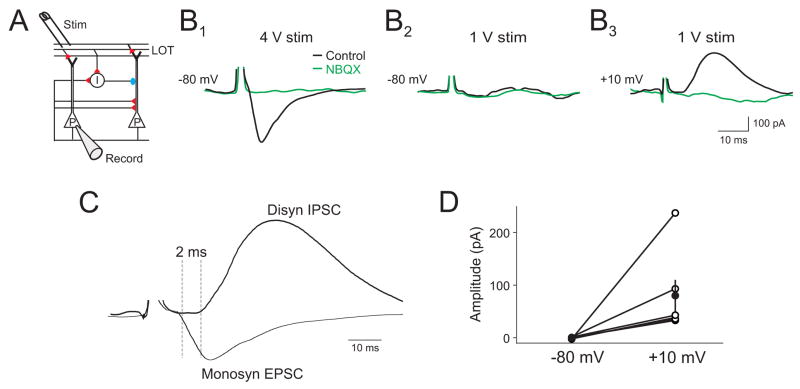
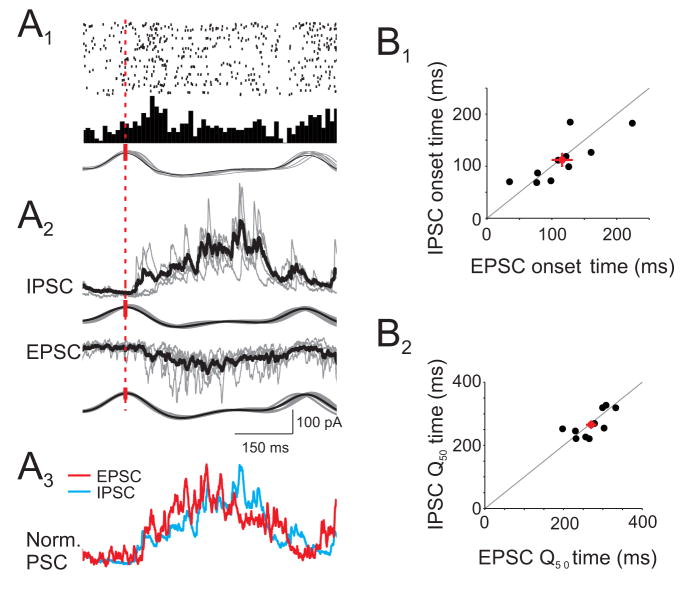
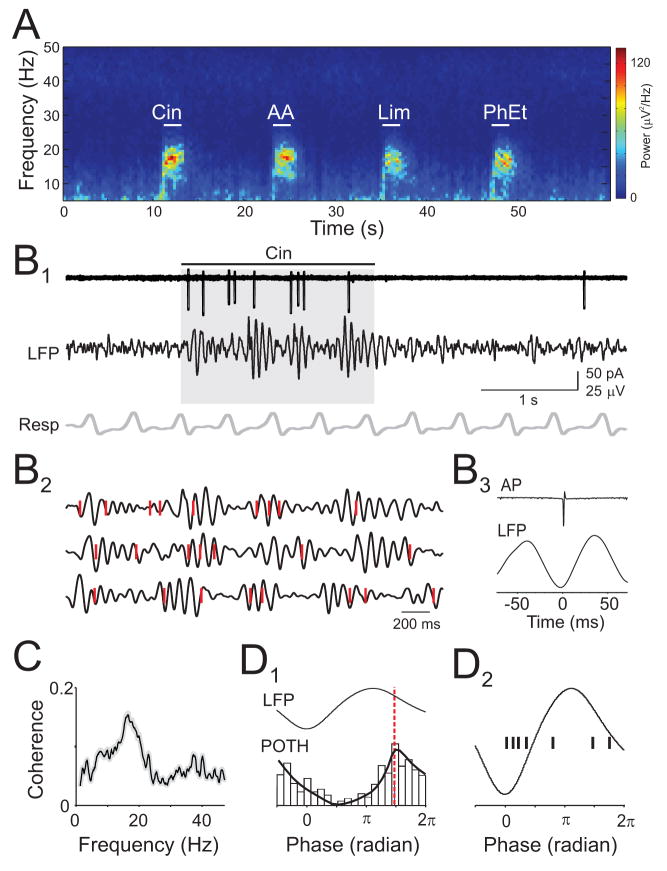
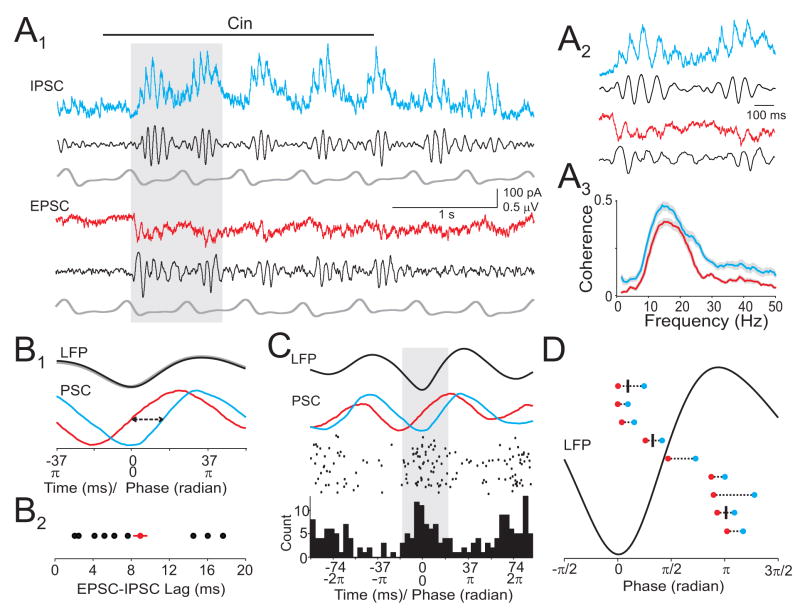
The properties of cortical circuits underlying central representations of sensory stimuli are poorly understood. Here we use in vivo cell-attached and whole-cell voltage-clamp recordings to reveal how excitatory and inhibitory synaptic input govern odor representations in rat primary olfactory (piriform) cortex. We show that odors evoke spiking activity that is sparse across the cortical population. We find that unbalanced synaptic excitation and inhibition underlie sparse activity: inhibition is widespread and broadly tuned, while excitation is less common and odor-specific. "Global" inhibition can be explained by local interneurons that receive ubiquitous and nonselective odor-evoked excitation. In the temporal domain, while respiration imposes a slow rhythm to olfactory cortical responses, odors evoke fast (15-30 Hz) oscillations in synaptic activity. Oscillatory excitation precedes inhibition, generating brief time windows for precise and temporally sparse spike output. Together, our results reveal that global inhibition and oscillations are major synaptic mechanisms shaping odor representations in olfactory cortex.


Figures

Figure 1
Figure 1. Odor-evoked action potential responses are sparse in olfactory cortex
(A) Schematic of anterior piriform cortex (APC). Olfactory bulb (OB) M/T cells project axons via the lateral olfactory tract (LOT) onto L2/3 pyramidal cells (P) and local interneurons (I). Red, excitatory and blue, inhibitory synapses. (B) Raster plots of spikes from four representative cells. Top traces: cell-attached recording of spikes from Cell 1 and simultaneously monitored respiratory rhythm (Resp). Upward deflections in respiration trace correspond to inhalation. Bars indicate odor delivery (2 s) and pink shading indicates evoked responses. (C1) Distributions of spontaneous AP frequency (top, n=177 cells) and odor-evoked increases in firing rate (bottom, 72 responsive odor-cell pairs). (C2) Distribution of odor selectivity. (C3) Population response to individual odors. (C4) Mean spike count for each respiratory cycle (n=72 responsive odor-cell pairs). Dashed black line, mean spike count preceding odor delivery. Odors: cineole (Cin), amyl acetate (AA), R-limonene (Lim), phenyl ethylalchol (PhEt).
Figure 2
Figure 2. Odors evoke widespread and nonselective inhibition
(A) Peristimulus time histogram of APs recorded in cell-attached mode from a single cell. Bars indicate odor delivery. (B) Subsequent voltage clamp recording of excitation (EPSC) and inhibition (IPSC) from the same cell in (A). ○, odor response, ⌀, lack of response. Traces are averages of 5 trials. (C) Population responses to four odors (n=52 cells). (D) Cumulative probability distribution of odor selectivity for each cell. (E1) Normalized and ranked odor-evoked EPSC charge for cells with odor-evoked APs. IPSC charge (normalized to the strongest inhibitory response in each cell) is plotted for each of the corresponding odors ranked by EPSC strength (n =13 cells). (E2) EPSC and IPSC charge for odors that evoked spikes (Preferred) versus odors that did not generate spikes (Non-Preferred) in the same cells (n = 13 cells). Odors: cineole (Cin), amyl acetate (AA), R-limonene (Lim), phenyl ethylalcohol (PhEt).
Figure 3
Figure 3. Global inhibition is not dependent on odor identity and persists over a range of concentrations
(A1) Cumulative probability distribution of odor selectivity for cells tested with eight odors (n=34 cells). (A2) Population response of APs, EPSCs, and IPSCs for all cells (n=86 cells). (B) Representative average EPSCs and IPSCs from a L2/3 cell in response to two odors (B1,2) at 5% and 2% saturated vapor (SV). indicates a positive odor response,⌀ indicates a negative odor response. (C) Number of odors that evoked excitation and inhibition in cells tested with eight odors over a range of concentrations. Cells with excitatory responses to multiple odors at 5% SV were selected for these experiments. Each cell was tested with all odors at five concentrations (n=9 cells, * indicate p<0.05). (D1) Odor-evoked increases in EPSC and IPSC charge across odor concentrations. (D2) Normalized odor-evoked charge for EPSCs (red) and IPSCs (blue) plotted on a log-log scale. Odors: cineole (Cin), amyl acetate (AA), R-limonene (Lim), phenyl ethylalcohol (PhEt), eugenol (Eug), dimethyl pyrzadine (DiMth), citral (Cit), and ethyl butyrate (EtBut).
Figure 4
Figure 4. Interneurons receive widespread and broadly tuned odor-evoked excitation
(A1) Morphologically identified interneuron following in vivo recording. Only the soma and dendritic arbors are shown in reconstruction. (A2) Selectivity of odor-evoked EPSCs and IPSCs in interneurons. (A3) Interneuron population responses. (B1) Morphologically identified pyramidal cell. Only the soma and dendritic arbors are shown in reconstruction. (B2, 3) Pyramidal cell selectivity and population responses. Odors: cineole (Cin), amyl acetate (AA), R-limonene (Lim), phenyl ethylalcohol (PhEt).
Figure 5
Figure 5. Minimal stimulation of the LOT in vivo preferentially recruits disynaptic inhibition
(A) Schematic of recording setup. (B1) Under control conditions, direct LOT stimulation evokes a monosynaptic EPSC (Vm=−80 mV) at high stimulation intensity (4 V) in a L2/3 cell. (B2) Lowering stimulation intensity (1 V) fails to evoke an EPSC, while depolarization to +10 mV reveals an IPSC (B3). Subsequent application of NBQX (500 μM) to the cortical surface abolishes the monosynaptic EPSC and disynaptic IPSC (B1–3, green traces). (C) Overlay of monosynaptic EPSC and disynaptic IPSC. (D) Summary data of recruitment of disynaptic IPSCs (+10 mV) at stimulus intensities that failed to evoke EPSCs (−80 mV, n=5 cells).
Figure 6
Figure 6. Respiration-coupled synaptic excitation and inhibition temporally overlap
(A1) Raster plot (top) and peristimulus time histogram (middle) of odor-evoked APs aligned to respiration (bottom) from one cell. (A2) Respiration-triggered average EPSC and IPSC for the cell in (A1). Black trace, average current. Grey traces, single trials. Red dashed line notes the peak of inhalation to which responses were aligned. (A3) Normalized respiration-triggered EPSC (red, inverted) and IPSC (blue) have overlapping time courses. (B) Respiration-triggered EPSCs and IPSCs have similar onset times (B1) and time to 50% of charge transfer (B2) in individual cells (n=12 cells).
Figure 7
Figure 7. Odor-evoked spikes are phase-locked to beta frequency LFP oscillations
(A) Spectrogram of an LFP recording showing beta oscillations evoked by four odors. (B1) Simultaneously recorded odor-evoked APs (top), LFP (filtered at 5–30 Hz), and respiration (B2) Expansion of grey shaded period in (B1) (top trace) and two other trials. Red ticks indicate APs. (B3) Spike-triggered average LFP from the same cell. (C) Average coherence between odor-evoked APs and LFPs (n=9 cells). (D1) Peri-oscillation triggered histogram (POTH) of odor-evoked spikes from cell shown in (B) superimposed with a local linear fit. Red dashed line indicates peak of POTH used to determine AP-LFP phase. (D2) AP-LFP phase relationships (black ticks) for 7 cells.
Figure 8
Figure 8. Oscillating excitatory and inhibitory synaptic currents govern spike timing
(A1) Simultaneous recording of synaptic currents and LFP. Grey shaded period is expanded in (A2). (A3) Average coherence between odor-evoked synaptic currents and LFPs (n=9 cells). (B1) LFP oscillation-triggered average EPSC (red) and IPSC (blue) from cell in (A). EPSC is shown inverted. Arrows, lag time measured as interval between EPSC and IPSC 50% rise times (T50). (B2) Summary of EPSC-IPSC lag time for 9 cells. (C) Top traces: LFP and oscillation-triggered EPSC and IPSC. Bottom panels: peri-oscillation triggered raster and spike histogram for the same cell. (D) Summary of EPSC-IPSC timing relative to LFP phase for 9 cells. Red: EPSC T50, blue: IPSC T50. AP-LFP phase relationships (black ticks) are shown superimposed for the three cells that fired APs in response to odors.

Comment in

References

    1. Adrian ED. Olfactory reactions in the brain of the hedgehog. J Physiol. 1942;100:459–473. - PMC - PubMed
    1. Anderson JS, Carandini M, Ferster D. Orientation tuning of input conductance, excitation, and inhibition in cat primary visual cortex. J Neurophysiol. 2000;84:909–926. - PubMed
    1. Bathellier B, Buhl DL, Accolla R, Carleton A. Dynamic ensemble odor coding in the mammalian olfactory bulb: sensory information at different timescales. Neuron. 2008;57:586–598. - PubMed
    1. Brecht M, Sakmann B. Dynamic representation of whisker deflection by synaptic potentials in spiny stellate and pyramidal cells in the barrels and septa of layer 4 rat somatosensory cortex. J Physiol. 2002;543:49–70. - PMC - PubMed
    1. Buonviso N, Amat C, Litaudon P. Respiratory modulation of olfactory neurons in the rodent brain. Chem Senses. 2006;31:145–154. - PubMed

Publication types

MeSH terms

Substances