

Assessment of gliosis around moveable implants in the brain
- PMID: 19556680
- PMCID: PMC2813571
- DOI: 10.1088/1741-2560/6/4/046004
Assessment of gliosis around moveable implants in the brain
Abstract
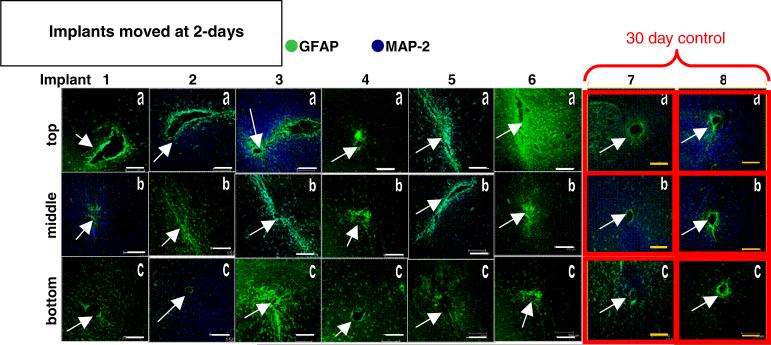
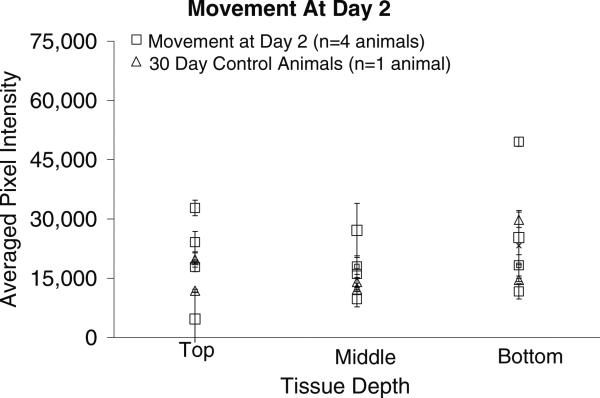
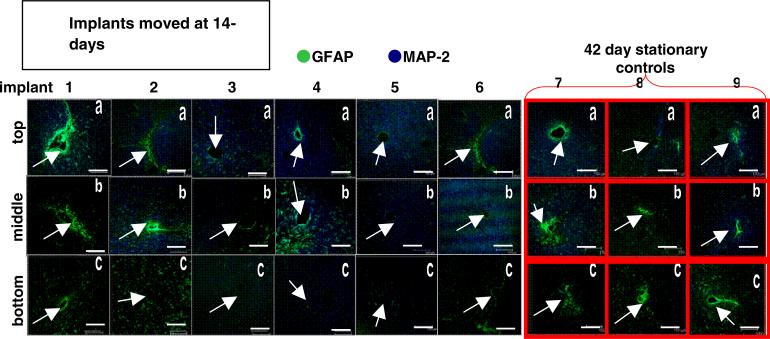
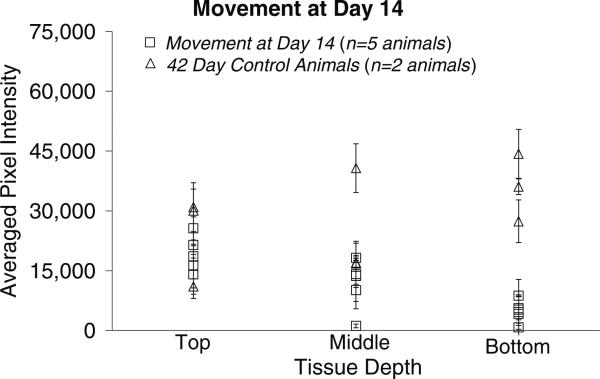
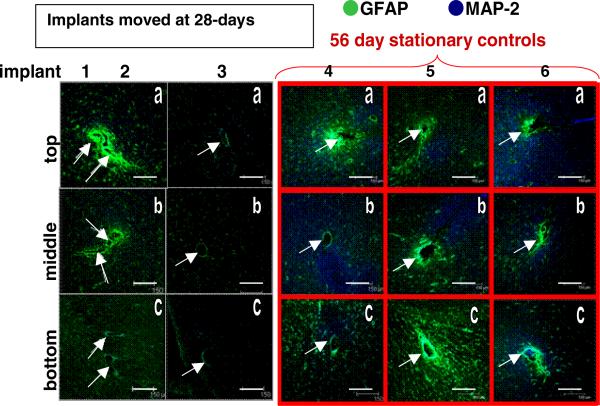
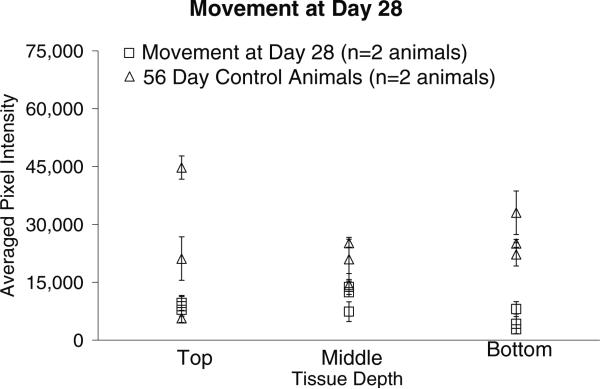
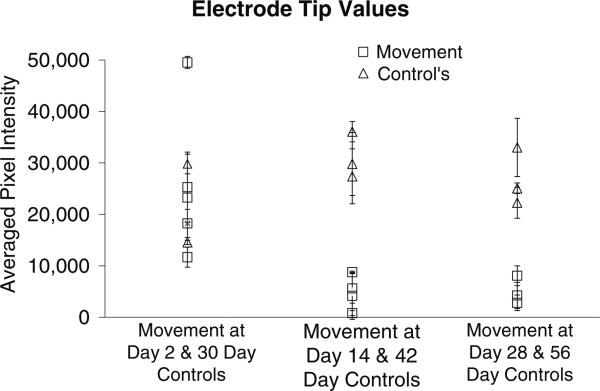
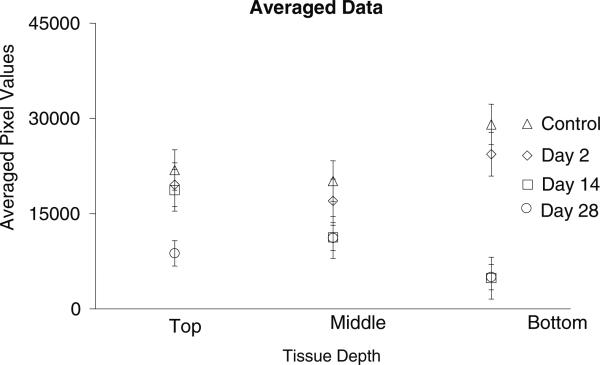
Repositioning microelectrodes post-implantation is emerging as a promising approach to achieve long-term reliability in single neuronal recordings. The main goal of this study was to (a) assess glial reaction in response to movement of microelectrodes in the brain post-implantation and (b) determine an optimal window of time post-implantation when movement of microelectrodes within the brain would result in minimal glial reaction. Eleven Sprague-Dawley rats were implanted with two microelectrodes each that could be moved in vivo post-implantation. Three cohorts were investigated: (1) microelectrode moved at day 2 (n = 4 animals), (2) microelectrode moved at day 14 (n = 5 animals) and (3) microelectrode moved at day 28 (n = 2 animals). Histological evaluation was performed in cohorts 1-3 at four-week post-movement (30 days, 42 days and 56 days post-implantation, respectively). In addition, five control animals were implanted with microelectrodes that were not moved. Control animals were implanted for (1) 30 days (n = 1), (2) 42 days (n = 2) and (3) 56 days (n = 2) prior to histological evaluation. Quantitative assessment of glial fibrillary acidic protein (GFAP) around the tip of the microelectrodes demonstrated that GFAP levels were similar around microelectrodes moved at day 2 when compared to the 30-day controls. However, GFAP expression levels around microelectrode tips that moved at day 14 and day 28 were significantly less than those around control microelectrodes implanted for 42 and 56 days, respectively. Therefore, we conclude that moving microelectrodes after implantation is a viable strategy that does not result in any additional damage to brain tissue. Further, moving the microelectrode downwards after 14 days of implantation may actually reduce the levels of GFAP expression around the tips of the microelectrodes in the long term.
Figures
Similar articles
-
Correlations between histology and neuronal activity recorded by microelectrodes implanted chronically in the cerebral cortex.J Neural Eng. 2016 Jun;13(3):036012. doi: 10.1088/1741-2560/13/3/036012. Epub 2016 Apr 25. J Neural Eng. 2016. PMID: 27108712 Free PMC article.
-
Evaluating the in vivo glial response to miniaturized parylene cortical probes coated with an ultra-fast degrading polymer to aid insertion.J Neural Eng. 2018 Jun;15(3):036002. doi: 10.1088/1741-2552/aa9fad. Epub 2018 Feb 27. J Neural Eng. 2018. PMID: 29485103 Free PMC article.
-
Thin microelectrodes reduce GFAP expression in the implant site in rodent somatosensory cortex.J Neural Eng. 2007 Jun;4(2):42-53. doi: 10.1088/1741-2560/4/2/005. Epub 2007 Feb 1. J Neural Eng. 2007. PMID: 17409479
-
Long-term changes in the material properties of brain tissue at the implant-tissue interface.J Neural Eng. 2013 Dec;10(6):066001. doi: 10.1088/1741-2560/10/6/066001. Epub 2013 Oct 8. J Neural Eng. 2013. PMID: 24099854 Free PMC article.
-
Nanoscale laminin coating modulates cortical scarring response around implanted silicon microelectrode arrays.J Neural Eng. 2006 Dec;3(4):316-26. doi: 10.1088/1741-2560/3/4/009. Epub 2006 Nov 15. J Neural Eng. 2006. PMID: 17124336
Cited by
-
Finite Element Modeling of Magnitude and Location of Brain Micromotion Induced Strain for Intracortical Implants.Front Neurosci. 2022 Jan 6;15:727715. doi: 10.3389/fnins.2021.727715. eCollection 2021. Front Neurosci. 2022. PMID: 35069092 Free PMC article.
-
Modeling the Insertion Mechanics of Flexible Neural Probes Coated with Sacrificial Polymers for Optimizing Probe Design.Sensors (Basel). 2016 Mar 4;16(3):330. doi: 10.3390/s16030330. Sensors (Basel). 2016. PMID: 26959021 Free PMC article.
-
Distribution and Morphology of Calcium-Binding Proteins Immunoreactive Neurons following Chronic Tungsten Multielectrode Implants.PLoS One. 2015 Jun 22;10(6):e0130354. doi: 10.1371/journal.pone.0130354. eCollection 2015. PLoS One. 2015. PMID: 26098896 Free PMC article.
-
Astrocytic Response to Acutely- and Chronically-Implanted Microelectrode Arrays in the Marmoset (Callithrix jacchus) Brain.Brain Sci. 2019 Jan 23;9(2):19. doi: 10.3390/brainsci9020019. Brain Sci. 2019. PMID: 30678038 Free PMC article.
-
Telemetry-controlled simultaneous stimulation-and-recording device (SRD) to study interhemispheric cortical circuits in rat primary somatosensory (SI) cortex.BMC Biomed Eng. 2019 Aug 8;1:19. doi: 10.1186/s42490-019-0019-7. eCollection 2019. BMC Biomed Eng. 2019. PMID: 32903340 Free PMC article.
References
-
- Kuchta J. Neuroprosthetic hearing with auditory brainstem implants. Biomed. Tech. (Berl) 2004;49:83–7. - PubMed
-
- Rauschecker JP, Shannon RV. Sending sound to the brain. Science. 2002;295:1025–9. - PubMed
-
- Tagliati M, Shils J, Sun C, Alterman R. Deep brain stimulation for dystonia. Expert. Rev. Med. Devices. 2004;1:33–41. - PubMed
-
- McNaughton BL, O'Keefe J, Barnes CA. The stereotrode: a new technique for simultaneous isolation of several single units in the central nervous system from multiple unit records. J. Neurosci. Methods. 1983;8:391–7. - PubMed
-
- Polikov VS, Tresco PA, Reichert WM. Response of brain tissue to chronically implanted neural electrodes. J. Neurosci. Methods. 2005;148:1–18. - PubMed
Publication types
MeSH terms
Substances
Grants and funding
LinkOut - more resources
Full Text Sources
Other Literature Sources
Miscellaneous