Meta-Analysis
. 2009 Jun;5(6):e1000508.
doi: 10.1371/journal.pgen.1000508. Epub 2009 Jun 26.

Genome-wide association scan meta-analysis identifies three Loci influencing adiposity and fat distribution

Cecilia M Lindgren  1 Iris M HeidJoshua C RandallClaudia LaminaValgerdur SteinthorsdottirLu QiElizabeth K SpeliotesGudmar ThorleifssonCristen J WillerBlanca M HerreraAnne U JacksonNoha LimPaul ScheetNicole SoranzoNajaf AminYurii S AulchenkoJohn C ChambersAlexander DrongJian'an LuanHelen N LyonFernando RivadeneiraSerena SannaNicholas J TimpsonM Carola ZillikensJing Hua ZhaoPeter AlmgrenStefania BandinelliAmanda J BennettRichard N BergmanLori L BonnycastleSuzannah J BumpsteadStephen J ChanockLynn CherkasPeter ChinesLachlan CoinCyrus CooperGabriel CrawfordAngela DoeringAnna DominiczakAlex S F DoneyShah EbrahimPaul ElliottMichael R ErdosKarol EstradaLuigi FerrucciGuido FischerNita G ForouhiChristian GiegerHarald GrallertChristopher J GrovesScott GrundyCandace GuiducciDavid HadleyAnders HamstenAki S HavulinnaAlbert HofmanRolf HolleJohn W HollowayThomas IlligBo IsomaaLeonie C JacobsKaren JamesonPekka JousilahtiFredrik KarpeJohanna KuusistoJaana LaitinenG Mark LathropDebbie A LawlorMassimo ManginoWendy L McArdleThomas MeitingerMario A MorkenAndrew P MorrisPatricia MunroeNarisu NarisuAnna NordströmPeter NordströmBen A OostraColin N A PalmerFelicity PayneJohn F PedenInga ProkopenkoFrida RenströmAimo RuokonenVeikko SalomaaManjinder S SandhuLaura J ScottAngelo ScuteriKaisa SilanderKijoung SongXin YuanHeather M StringhamAmy J SwiftTiinamaija TuomiManuela UdaPeter VollenweiderGerard WaeberChris WallaceG Bragi WaltersMichael N WeedonWellcome Trust Case Control ConsortiumJacqueline C M WittemanCuilin ZhangWeihua ZhangMark J CaulfieldFrancis S CollinsGeorge Davey SmithIan N M DayPaul W FranksAndrew T HattersleyFrank B HuMarjo-Riitta JarvelinAugustine KongJaspal S KoonerMarkku LaaksoEdward LakattaVincent MooserAndrew D MorrisLeena PeltonenNilesh J SamaniTimothy D SpectorDavid P StrachanToshiko TanakaJaakko TuomilehtoAndré G UitterlindenCornelia M van DuijnNicholas J WarehamHugh WatkinsProcardis ConsortiaDawn M WaterworthMichael BoehnkePanos DeloukasLeif GroopDavid J HunterUnnur ThorsteinsdottirDavid SchlessingerH-Erich WichmannTimothy M FraylingGonçalo R AbecasisJoel N HirschhornRuth J F LoosKari StefanssonKaren L MohlkeInês BarrosoMark I McCarthyGiant Consortium
Affiliations
Meta-Analysis

Genome-wide association scan meta-analysis identifies three Loci influencing adiposity and fat distribution

Cecilia M Lindgren et al. PLoS Genet. 2009 Jun.

Erratum in

  • PLoS Genet. 2009 Jul;5(7). doi: 10.1371/annotation/b6e8f9f6-2496-4a40-b0e3-e1d1390c1928

Abstract

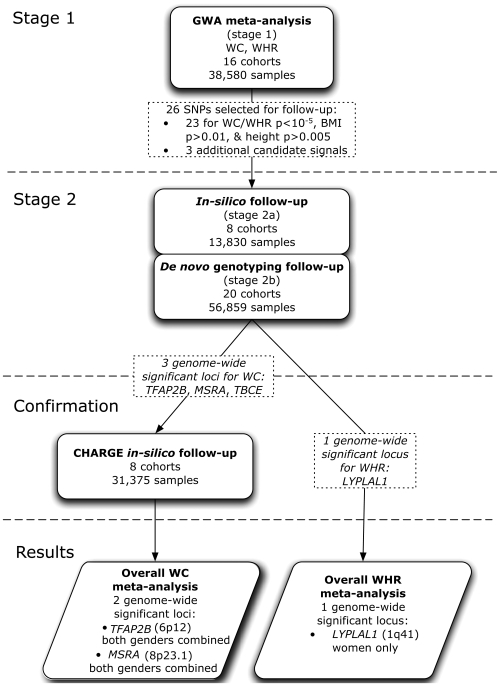
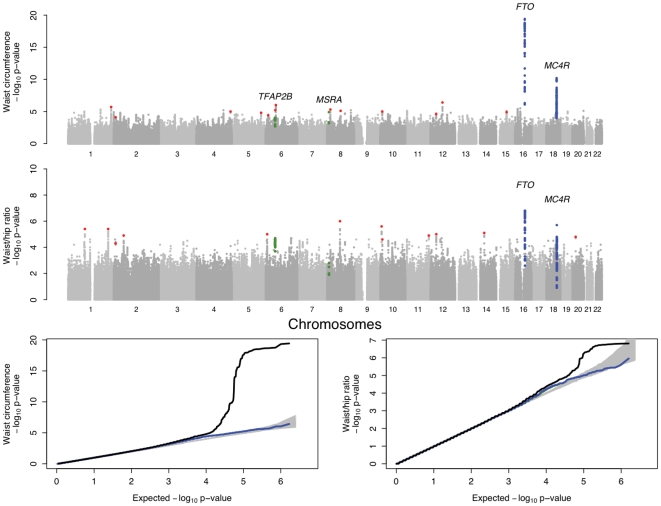
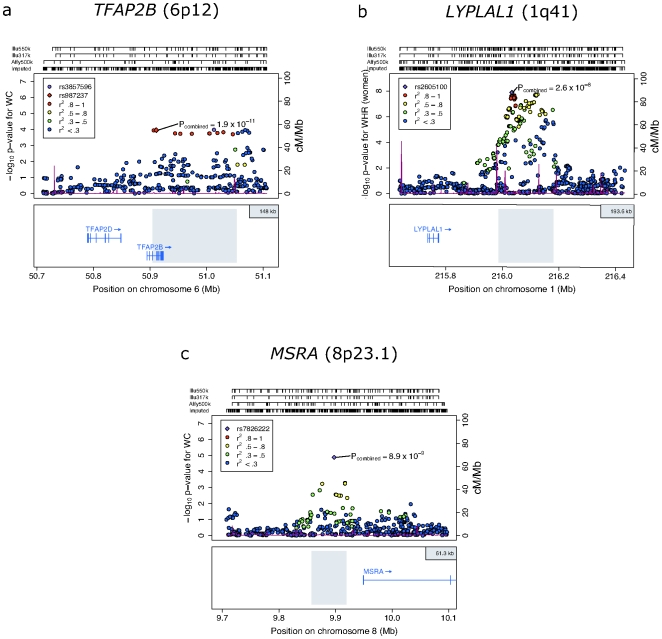
To identify genetic loci influencing central obesity and fat distribution, we performed a meta-analysis of 16 genome-wide association studies (GWAS, N = 38,580) informative for adult waist circumference (WC) and waist-hip ratio (WHR). We selected 26 SNPs for follow-up, for which the evidence of association with measures of central adiposity (WC and/or WHR) was strong and disproportionate to that for overall adiposity or height. Follow-up studies in a maximum of 70,689 individuals identified two loci strongly associated with measures of central adiposity; these map near TFAP2B (WC, P = 1.9x10(-11)) and MSRA (WC, P = 8.9x10(-9)). A third locus, near LYPLAL1, was associated with WHR in women only (P = 2.6x10(-8)). The variants near TFAP2B appear to influence central adiposity through an effect on overall obesity/fat-mass, whereas LYPLAL1 displays a strong female-only association with fat distribution. By focusing on anthropometric measures of central obesity and fat distribution, we have identified three loci implicated in the regulation of human adiposity.


Conflict of interest statement

The authors from Decode Genetics Inc. own stocks and stock options in the company. VM, NL, KS and DMW are full-time employees of GlaxoSmithKline, a pharmaceutical company. The other authors have no competing interests to declare.

Figures

Figure 1
Figure 1. Project outline.
We started out with a meta-analysis of GWAS data from 16 cohorts comprising 38,580 individuals informative for WC and 37,670 for WHR. We selected 23 SNPs of our top signals based on the following criteria (Table S2): preliminary stage 1 meta-analysis P-value≤10−5, BMI P-value>0.01 and height P-value>5×10⁻³. We supplemented these 23 independent loci (r2<0.2) SNPs with three additional candidate signals. Further, we excluded recently reported BMI loci (Table S10) , , –. These 26 SNPs were followed up in our stage 2 samples (N = maximum of 70,689 individuals). Further, we sought to confirm WC signals reaching genome wide significance in the combined analysis of stage 1 and 2 data in GWA data from the CHARGE consortium (for which WHR was not available). The data from the Rotterdam and ERF cohorts (up to 6,702 individuals) which were included in both CHARGE and stage 2 data, were counted only once in the overall analysis.
Figure 2
Figure 2. Genome-wide association results for GIANT (Stage 1).
A. Manhattan plots showing significance of association of all SNPs in the Stage 1 GIANT meta-analysis with central obesity phenotypes. SNPs are plotted on the x-axis according to their position on each chromosome against association with central obesity measure (WC or WHR) on the y-axis (shown as −log10 P-value). SNPs that have been previously reported to show association with BMI is shown in blue ,, and the two regions showing strong associations in the overall, non-gender-stratified analyses are shown in green. Other SNPs taken forward into stage 2 follow-up are indicated in red. B. Quantile-quantile (QQ) plots of SNPs; after Stage 1 GIANT meta-analysis (black) and after removing any SNPs surrounding the recently reported BMI loci , , – (blue). The grey areas in the QQ plots represent the 95% confidence intervals around the test statistics and after excluding the recently reported BMI loci , , –, there is no indication of excess of signal.
Figure 3
Figure 3. Regional plots of loci highlighted in this study.
SNPs are plotted by position on chromosome against association (−log10 p-value) with central obesity phenotype (WC or WHR) using stage 1 (GWAS meta-analysis) data. In the case of panel (b), analyses are restricted to women only. In each panel, the SNP with the strongest association based on stage 1 data is denoted with a purple diamond: the P-value attached represents the final P-value attained across all available data (Table 1). Estimated recombination rates (from HapMap-CEU) are plotted in purple to reflect the local LD structure on a secondary Y-axis. The SNPs surrounding the most significant SNP (purple diamond) are color-coded (see inset) to reflect their LD with this SNP (using pair-wise r2 values from HapMap CEU). Genes and the position of exons, as well as the direction of transcription, are shown below the plots (using data from the UCSC genome browser, genome.ucsc.edu). The grey area marks the extent of the region that includes any SNP with r2≥0.3 relative to the SNP with the strongest stage 1 association signal. Hash marks represent SNP positions on each genotyping array used by any individual study and also show SNP positions after imputation.

Similar articles

  • Implications of central obesity-related variants in LYPLAL1, NRXN3, MSRA, and TFAP2B on quantitative metabolic traits in adult Danes.
    Bille DS, Banasik K, Justesen JM, Sandholt CH, Sandbæk A, Lauritzen T, Jørgensen T, Witte DR, Holm JC, Hansen T, Pedersen O. Bille DS, et al. PLoS One. 2011;6(6):e20640. doi: 10.1371/journal.pone.0020640. Epub 2011 Jun 2. PLoS One. 2011. PMID: 21674055 Free PMC article.
  • Genome-wide association of body fat distribution in African ancestry populations suggests new loci.
    Liu CT, Monda KL, Taylor KC, Lange L, Demerath EW, Palmas W, Wojczynski MK, Ellis JC, Vitolins MZ, Liu S, Papanicolaou GJ, Irvin MR, Xue L, Griffin PJ, Nalls MA, Adeyemo A, Liu J, Li G, Ruiz-Narvaez EA, Chen WM, Chen F, Henderson BE, Millikan RC, Ambrosone CB, Strom SS, Guo X, Andrews JS, Sun YV, Mosley TH, Yanek LR, Shriner D, Haritunians T, Rotter JI, Speliotes EK, Smith M, Rosenberg L, Mychaleckyj J, Nayak U, Spruill I, Garvey WT, Pettaway C, Nyante S, Bandera EV, Britton AF, Zonderman AB, Rasmussen-Torvik LJ, Chen YD, Ding J, Lohman K, Kritchevsky SB, Zhao W, Peyser PA, Kardia SL, Kabagambe E, Broeckel U, Chen G, Zhou J, Wassertheil-Smoller S, Neuhouser ML, Rampersaud E, Psaty B, Kooperberg C, Manson JE, Kuller LH, Ochs-Balcom HM, Johnson KC, Sucheston L, Ordovas JM, Palmer JR, Haiman CA, McKnight B, Howard BV, Becker DM, Bielak LF, Liu Y, Allison MA, Grant SF, Burke GL, Patel SR, Schreiner PJ, Borecki IB, Evans MK, Taylor H, Sale MM, Howard V, Carlson CS, Rotimi CN, Cushman M, Harris TB, Reiner AP, Cupples LA, North KE, Fox CS. Liu CT, et al. PLoS Genet. 2013;9(8):e1003681. doi: 10.1371/journal.pgen.1003681. Epub 2013 Aug 15. PLoS Genet. 2013. PMID: 23966867 Free PMC article.
  • Susceptibility variants for waist size in relation to abdominal, visceral, and hepatic adiposity in postmenopausal women.
    Lim U, Ernst T, Wilkens LR, Albright CL, Lum-Jones A, Seifried A, Buchthal SD, Novotny R, Kolonel LN, Chang L, Cheng I, Le Marchand L. Lim U, et al. J Acad Nutr Diet. 2012 Jul;112(7):1048-55. doi: 10.1016/j.jand.2012.03.034. J Acad Nutr Diet. 2012. PMID: 22889634 Free PMC article.
  • The genetics of adiposity.
    Loos RJ. Loos RJ. Curr Opin Genet Dev. 2018 Jun;50:86-95. doi: 10.1016/j.gde.2018.02.009. Epub 2018 Mar 9. Curr Opin Genet Dev. 2018. PMID: 29529423 Free PMC article. Review.
  • Aldehyde Dehydrogenases Genetic Polymorphism and Obesity: From Genomics to Behavior and Health.
    Hu C. Hu C. Adv Exp Med Biol. 2019;1193:135-154. doi: 10.1007/978-981-13-6260-6_8. Adv Exp Med Biol. 2019. PMID: 31368102 Review.

Cited by

References

    1. Pischon T, Boeing H, Hoffmann K, Bergmann M, Schulze MB, et al. General and abdominal adiposity and risk of death in Europe. N Engl J Med. 2008;359:2105–2120. - PubMed
    1. Yusuf S, Hawken S, Ounpuu S, Bautista L, Franzosi MG, et al. Obesity and the risk of myocardial infarction in 27,000 participants from 52 countries: a case-control study. Lancet. 2005;366:1640–1649. - PubMed
    1. Baik I, Ascherio A, Rimm EB, Giovannucci E, Spiegelman D, et al. Adiposity and mortality in men. Am J Epidemiol. 2000;152:264–271. - PubMed
    1. Kamel EG, McNeill G, Van Wijk MC. Usefulness of anthropometry and DXA in predicting intra-abdominal fat in obese men and women. Obes Res. 2000;8:36–42. - PubMed
    1. Schousboe K, Willemsen G, Kyvik KO, Mortensen J, Boomsma DI, et al. Sex differences in heritability of BMI: a comparative study of results from twin studies in eight countries. Twin Res. 2003;6:409–421. - PubMed

Publication types

Grants and funding