

Evolution of mutational robustness in the yeast genome: a link to essential genes and meiotic recombination hotspots
- PMID: 19557188
- PMCID: PMC2694357
- DOI: 10.1371/journal.pgen.1000533
Evolution of mutational robustness in the yeast genome: a link to essential genes and meiotic recombination hotspots
Abstract
Deleterious mutations inevitably emerge in any evolutionary process and are speculated to decisively influence the structure of the genome. Meiosis, which is thought to play a major role in handling mutations on the population level, recombines chromosomes via non-randomly distributed hot spots for meiotic recombination. In many genomes, various types of genetic elements are distributed in patterns that are currently not well understood. In particular, important (essential) genes are arranged in clusters, which often cannot be explained by a functional relationship of the involved genes. Here we show by computer simulation that essential gene (EG) clustering provides a fitness benefit in handling deleterious mutations in sexual populations with variable levels of inbreeding and outbreeding. We find that recessive lethal mutations enforce a selective pressure towards clustered genome architectures. Our simulations correctly predict (i) the evolution of non-random distributions of meiotic crossovers, (ii) the genome-wide anti-correlation of meiotic crossovers and EG clustering, (iii) the evolution of EG enrichment in pericentromeric regions and (iv) the associated absence of meiotic crossovers (cold centromeres). Our results furthermore predict optimal crossover rates for yeast chromosomes, which match the experimentally determined rates. Using a Saccharomyces cerevisiae conditional mutator strain, we show that haploid lethal phenotypes result predominantly from mutation of single loci and generally do not impair mating, which leads to an accumulation of mutational load following meiosis and mating. We hypothesize that purging of deleterious mutations in essential genes constitutes an important factor driving meiotic crossover. Therefore, the increased robustness of populations to deleterious mutations, which arises from clustered genome architectures, may provide a significant selective force shaping crossover distribution. Our analysis reveals a new aspect of the evolution of genome architectures that complements insights about molecular constraints, such as the interference of pericentromeric crossovers with chromosome segregation.
Conflict of interest statement
The authors have declared that no competing interests exist.
Figures
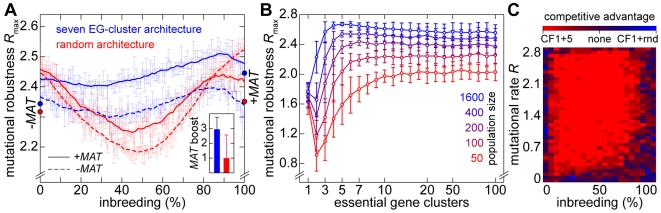
 (average of the entire inbreeding/outbreeding domain, bars indicate SD) as a function of the level of EG clustering (ranging from perfect clustering (1) with all EGs joined in one single continuous cluster, to a maximally unclustered architecture (100) with each pair of EGs separated by at least one meiotic recombination hotspot). The population size cap is color-encoded (ranging from 50 to 1,600 individuals). Simulation time was conservatively assigned; a further increase in the maximum number of generations did not change the simulation outcome significantly. (C) Results of survival competition experiments for model chromosomes with one MAT-linked cluster and five clusters in the chromosomal arm region (CF1+5) versus model chromosomes with one MAT-linked cluster and a random EG distribution in the arm region (CF1+R), for the entire inbreeding/outbreeding domain and high mutation rates up to Rmax (n = 10 experiments per grid point). The competitive advantage is color-encoded (bright red: CF1+5 won all competitions, bright blue: CF1+R won all competitions). The population size cap was set to 1,000 individuals. For simulation details and statistical information see Text S1, section “S. digitalis Simulation Settings.”
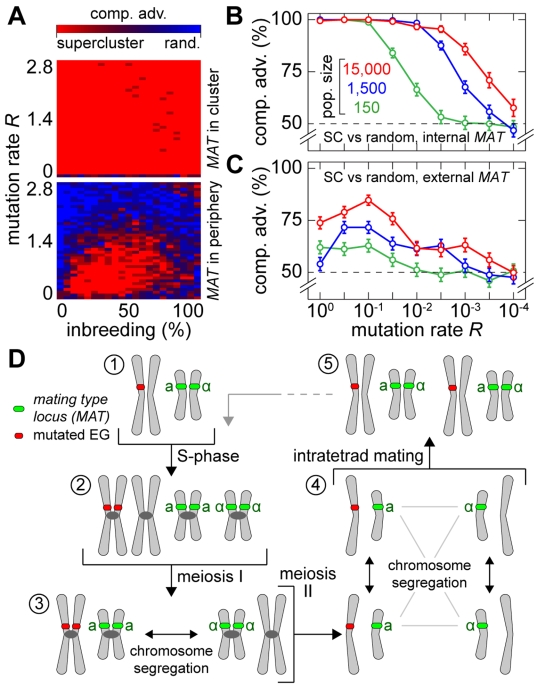
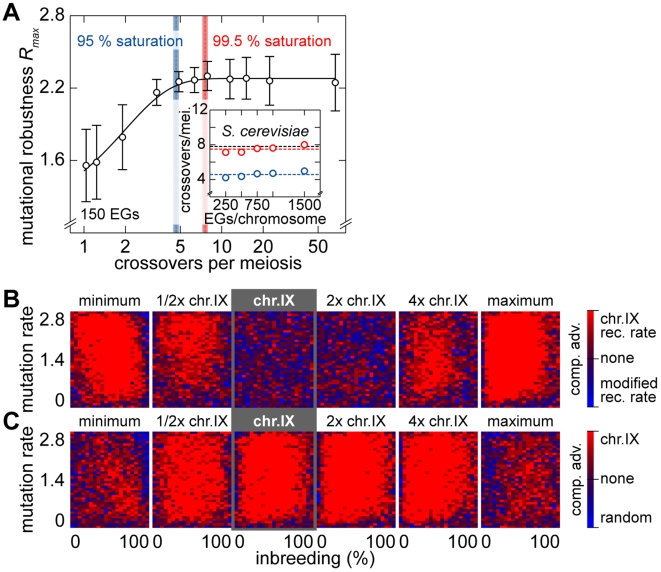
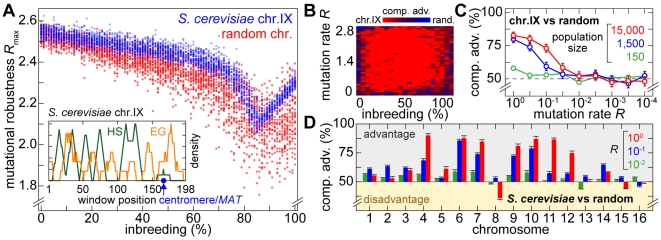
 as a function of the number of crossovers per meiosis (logarithmic scale) for populations of random chromosomes with 750 genes (20% EGs). Bars indicate the SD of R
max for the entire inbreeding/outbreeding domain. Inset: Number of crossovers per meiosis required to reach 95% and 99.5% respectively of the maximum mutational robustness R
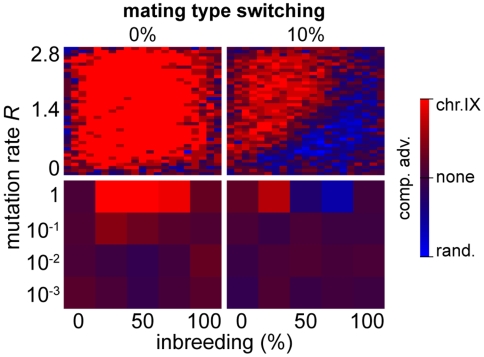
max, for chromosomes of different lengths (250, 500, 750, 1,000, and 1,500 genes) and random configurations. (B) Results of survival competition experiments between two chromosome IX populations subjected to different crossing over rates (n = 5 experiments per grid point), for mutation rates R up to Rmax and for the entire inbreeding/outbreeding domain. The color-code indicates the winning chromosome architecture. (C) Results of survival competition experiments between yeast chromosome IX and random chromosomes at different crossing over rates (n = 10 experiments per grid point). Same experimental conditions as in (B). Supplementary Figure 8 in Text S1 shows plots for average fitness advantages of the results in (B) and (C). “minimum” = one crossover per chromosome and meiosis; “maximum” = all 58 hotspots are active in each meiosis. For simulation details and statistical information see Text S1, section “S. digitalis Simulation Settings.”
as a function of the number of crossovers per meiosis (logarithmic scale) for populations of random chromosomes with 750 genes (20% EGs). Bars indicate the SD of R
max for the entire inbreeding/outbreeding domain. Inset: Number of crossovers per meiosis required to reach 95% and 99.5% respectively of the maximum mutational robustness R
max, for chromosomes of different lengths (250, 500, 750, 1,000, and 1,500 genes) and random configurations. (B) Results of survival competition experiments between two chromosome IX populations subjected to different crossing over rates (n = 5 experiments per grid point), for mutation rates R up to Rmax and for the entire inbreeding/outbreeding domain. The color-code indicates the winning chromosome architecture. (C) Results of survival competition experiments between yeast chromosome IX and random chromosomes at different crossing over rates (n = 10 experiments per grid point). Same experimental conditions as in (B). Supplementary Figure 8 in Text S1 shows plots for average fitness advantages of the results in (B) and (C). “minimum” = one crossover per chromosome and meiosis; “maximum” = all 58 hotspots are active in each meiosis. For simulation details and statistical information see Text S1, section “S. digitalis Simulation Settings.”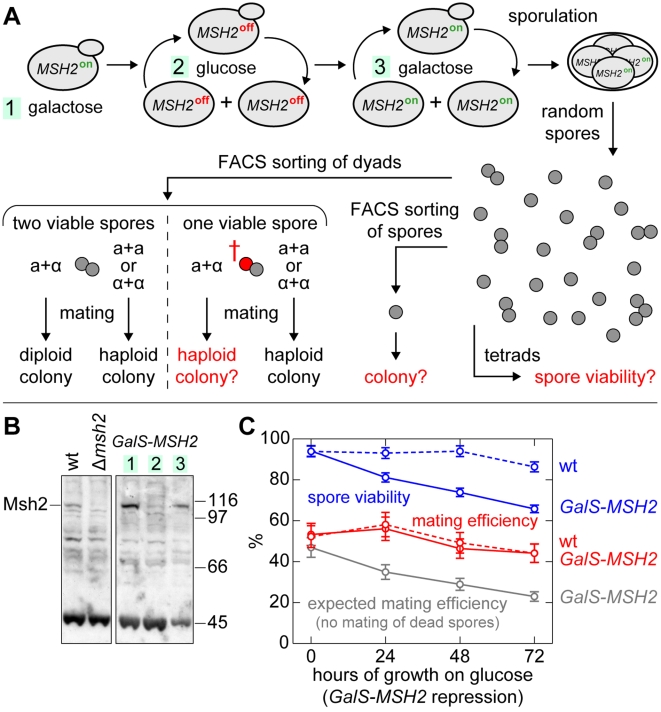
References
-
- Kondrashov AS. Classification of hypotheses on the advantage of amphimixis. J Hered. 1993;84:372–387. - PubMed
-
- Muller HJ. Some Genetic Aspects of Sex. American Naturalist. 1932;66:118–138.
-
- Fisher RA. The Genetical Theory of Natural Selection. Oxford, UK: Oxford University Press; 1930.
-
- Zeyl CW, Otto SP. A short history of recombination in yeast. Trends Ecol Evol. 2007;22:223–225. - PubMed
-
- Maynard Smith J, Szathmary E. The major transitions in eovlution. Oxford, UK: Oxford University Press; 1995.
Publication types
MeSH terms
LinkOut - more resources
Full Text Sources
Molecular Biology Databases
