

Exploring the free energy landscape: from dynamics to networks and back
- PMID: 19557191
- PMCID: PMC2694367
- DOI: 10.1371/journal.pcbi.1000415
Exploring the free energy landscape: from dynamics to networks and back
Abstract
Knowledge of the Free Energy Landscape topology is the essential key to understanding many biochemical processes. The determination of the conformers of a protein and their basins of attraction takes a central role for studying molecular isomerization reactions. In this work, we present a novel framework to unveil the features of a Free Energy Landscape answering questions such as how many meta-stable conformers there are, what the hierarchical relationship among them is, or what the structure and kinetics of the transition paths are. Exploring the landscape by molecular dynamics simulations, the microscopic data of the trajectory are encoded into a Conformational Markov Network. The structure of this graph reveals the regions of the conformational space corresponding to the basins of attraction. In addition, handling the Conformational Markov Network, relevant kinetic magnitudes as dwell times and rate constants, or hierarchical relationships among basins, completes the global picture of the landscape. We show the power of the analysis studying a toy model of a funnel-like potential and computing efficiently the conformers of a short peptide, dialanine, paving the way to a systematic study of the Free Energy Landscape in large peptides.
Conflict of interest statement
The authors have declared that no competing interests exist.
Figures
 and
and  .
.
 and
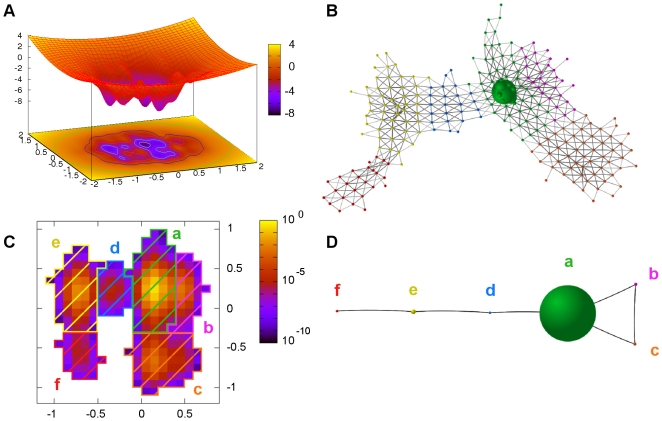
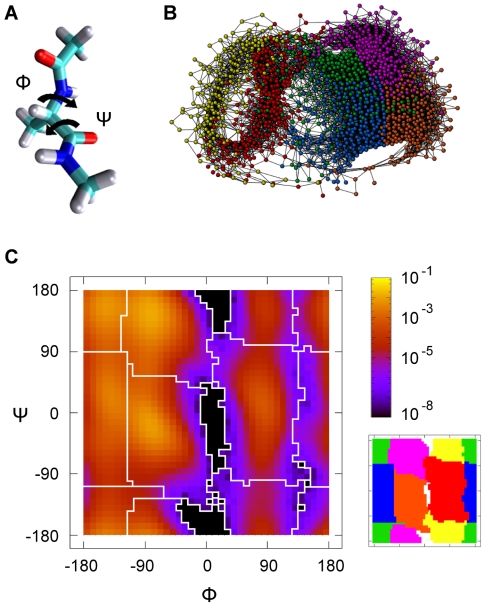
and  . (B) Plot of the CMN generated. The 6 sets of nodes (corresponding to different colors) are the result of the SSD algorithm. (C) Left: Ramachandran plot with the probability of occupation of the cells used to build the CMN. The boundaries of the free energy basins are shown in white. Right: the 6 basins represented as regions of different color. (Color code:
  ,
,  ,
,  ,
,  ,
,  and
and  ).
).
 ,
,  ,
,  ,
,  ) and (
 ,
,  ). Note that
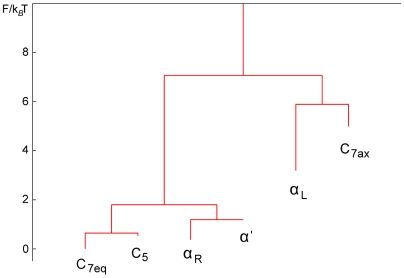
  looks like the conformer with the largest dwell time, in agreement with data in Table 1.
 , from any basin.
References
-
- Oltvai ZN, Barabási AL. Systems biology. Life's complexity pyramid. Science. 2002;298:763–764. - PubMed
-
- Parisi G. Complexity in biology: the point of view of a physicist. 1994. arXiv:cond-mat/9412018v1. Available: http://arxiv.org/abs/cs/0702048v1. Accessed 5 December 1994.
-
- Krivov SV, Karplus M. Free energy disconnectivity graphs: application to peptide models. J Chem Phys. 2002;117:10894–10903.
-
- Ottino JM. Complex systems. AIChE J. 2003;49:292–299.
Publication types
MeSH terms
Substances
LinkOut - more resources
Full Text Sources
