

Antimicrobial breakpoint estimation accounting for variability in pharmacokinetics
- PMID: 19558679
- PMCID: PMC2709609
- DOI: 10.1186/1742-4682-6-10
Antimicrobial breakpoint estimation accounting for variability in pharmacokinetics
Abstract
Background: Pharmacokinetic and pharmacodynamic (PK/PD) indices are increasingly being used in the microbiological field to assess the efficacy of a dosing regimen. In contrast to methods using MIC, PK/PD-based methods reflect in vivo conditions and are more predictive of efficacy. Unfortunately, they entail the use of one PK-derived value such as AUC or Cmax and may thus lead to biased efficiency information when the variability is large. The aim of the present work was to evaluate the efficacy of a treatment by adjusting classical breakpoint estimation methods to the situation of variable PK profiles.
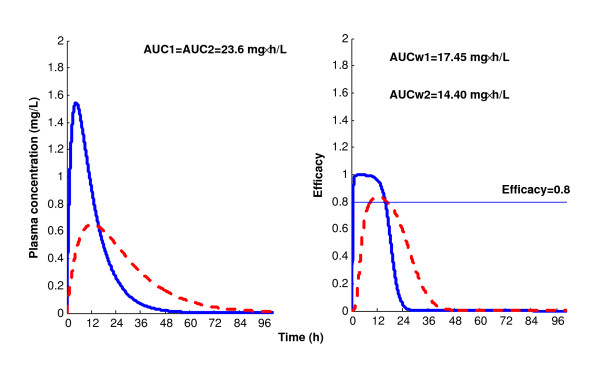
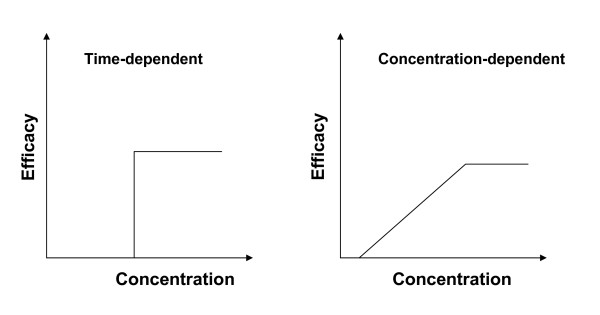
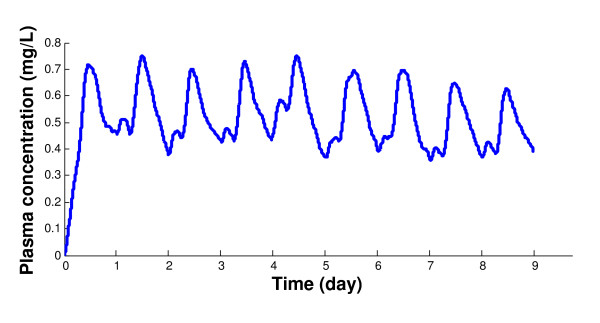
Methods and results: We propose a logical generalisation of the usual AUC methods by introducing the concept of "efficiency" for a PK profile, which involves the efficacy function as a weight. We formulated these methods for both classes of concentration- and time-dependent antibiotics. Using drug models and in silico approaches, we provide a theoretical basis for characterizing the efficiency of a PK profile under in vivo conditions. We also used the particular case of variable drug intake to assess the effect of the variable PK profiles generated and to analyse the implications for breakpoint estimation.
Conclusion: Compared to traditional methods, our weighted AUC approach gives a more powerful PK/PD link and reveals, through examples, interesting issues about the uniqueness of therapeutic outcome indices and antibiotic resistance problems.
Figures
 ,
,  ,
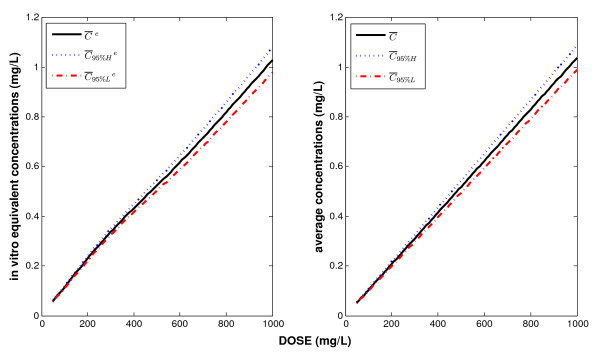
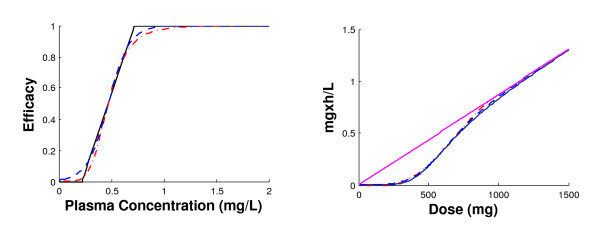
,  respectively. The right panel shows the average concentrations versus DOSE; the solid, dotted and dash-dot lines are
  ,
,  ,
,  respectively.
Similar articles
-
A proposal of a pharmacokinetic/pharmacodynamic (PK/PD) index map for selecting an optimal PK/PD index from conventional indices (AUC/MIC, Cmax/MIC, and TAM) for antibiotics.Drug Metab Pharmacokinet. 2014;29(6):455-62. doi: 10.2133/dmpk.DMPK-14-RG-013. Epub 2014 Jul 8. Drug Metab Pharmacokinet. 2014. PMID: 25008846
-
Combatting the Rising Tide of Antimicrobial Resistance: Pharmacokinetic/Pharmacodynamic Dosing Strategies for Maximal Precision.Int J Antimicrob Agents. 2021 Mar;57(3):106269. doi: 10.1016/j.ijantimicag.2020.106269. Epub 2020 Dec 23. Int J Antimicrob Agents. 2021. PMID: 33358761 Review.
-
How can we predict bacterial eradication?Int J Infect Dis. 2003 Mar;7 Suppl 1:S13-20. doi: 10.1016/s1201-9712(03)90066-x. Int J Infect Dis. 2003. PMID: 12839703 Review.
-
The integrated use of pharmacokinetic and pharmacodynamic models for the definition of breakpoints.Infection. 2005 Dec;33 Suppl 2:29-35. doi: 10.1007/s15010-005-8205-z. Infection. 2005. PMID: 16518709
-
Pharmacodynamics: relation to antimicrobial resistance.Am J Infect Control. 2006 Jun;34(5 Suppl 1):S38-45; discussion S64-73. doi: 10.1016/j.ajic.2006.05.227. Am J Infect Control. 2006. PMID: 16813981 Review.
Cited by
-
Unraveling Antimicrobial Resistance Dynamics in Mycoplasma gallisepticum: Insights Into Antibiotic and Disinfectant Interactions.Vet Med Sci. 2025 Jan;11(1):e70181. doi: 10.1002/vms3.70181. Vet Med Sci. 2025. PMID: 39792050 Free PMC article.
-
Reduced treatment frequencies with bumped kinase inhibitor 1369 are effective against porcine cystoisosporosis.Int J Parasitol Drugs Drug Resist. 2020 Dec;14:37-45. doi: 10.1016/j.ijpddr.2020.08.005. Epub 2020 Aug 21. Int J Parasitol Drugs Drug Resist. 2020. PMID: 32861205 Free PMC article.
-
Pharmacokinetics of a peroral single dose of two long-acting formulations and an aqueous formulation of doxycycline hyclate in horses.Acta Vet Scand. 2013 Mar 8;55(1):21. doi: 10.1186/1751-0147-55-21. Acta Vet Scand. 2013. PMID: 23497696 Free PMC article. Clinical Trial.
References
-
- Bryskier A. In: antibacterials and antifungals. André Bryskier, editor. Washington, D.C: ASM Press; 2005.
-
- Fauchère J-L. Bactériologie générale et médicale/Jean-Louis Fauchère, Jean-Loup Avril. Paris: Ellipses; 2002.
-
- Robert-Dernuet S. Antibiotiques et antibiogrammes/Sabine Robert-Dernuet; préface de Michel Laverdière; [illustrations, Bertrand Lachance. Paris: Vigot; 1995.
-
- MacGowan AP, Wise R. Establishing MIC breakpoints and the interpretation of in vitro susceptibility tests. J Antimicrob Chemother. 2001;48:17–28. - PubMed
Publication types
MeSH terms
Substances
LinkOut - more resources
Full Text Sources
Medical
