

Spatial analysis of plague in California: niche modeling predictions of the current distribution and potential response to climate change
- PMID: 19558717
- PMCID: PMC2716330
- DOI: 10.1186/1476-072X-8-38
Spatial analysis of plague in California: niche modeling predictions of the current distribution and potential response to climate change
Abstract
Background: Plague, caused by the bacterium Yersinia pestis, is a public and wildlife health concern in California and the western United States. This study explores the spatial characteristics of positive plague samples in California and tests Maxent, a machine-learning method that can be used to develop niche-based models from presence-only data, for mapping the potential distribution of plague foci. Maxent models were constructed using geocoded seroprevalence data from surveillance of California ground squirrels (Spermophilus beecheyi) as case points and Worldclim bioclimatic data as predictor variables, and compared and validated using area under the receiver operating curve (AUC) statistics. Additionally, model results were compared to locations of positive and negative coyote (Canis latrans) samples, in order to determine the correlation between Maxent model predictions and areas of plague risk as determined via wild carnivore surveillance.
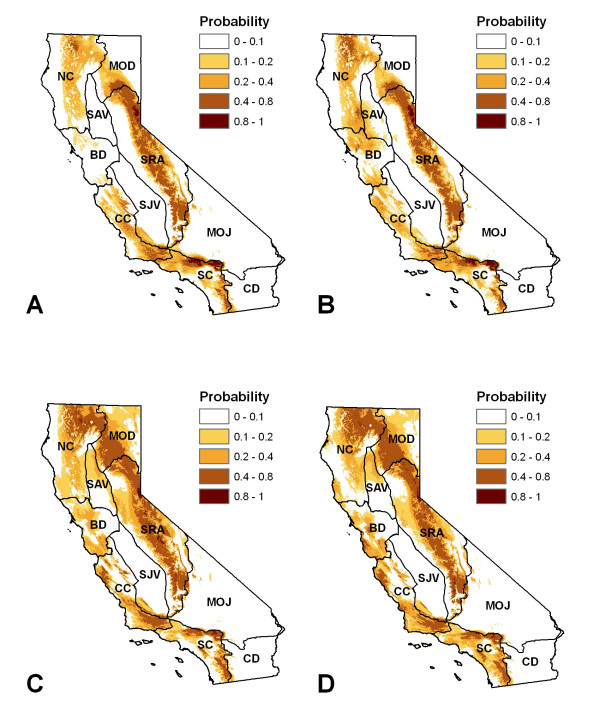
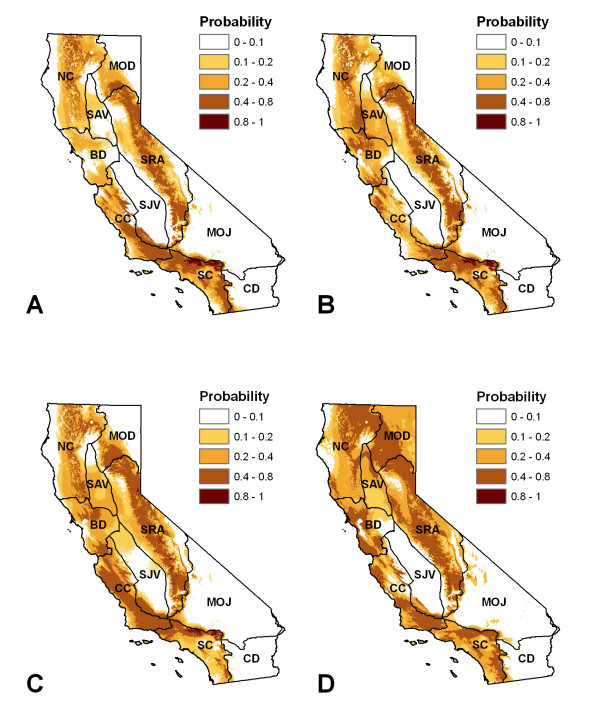
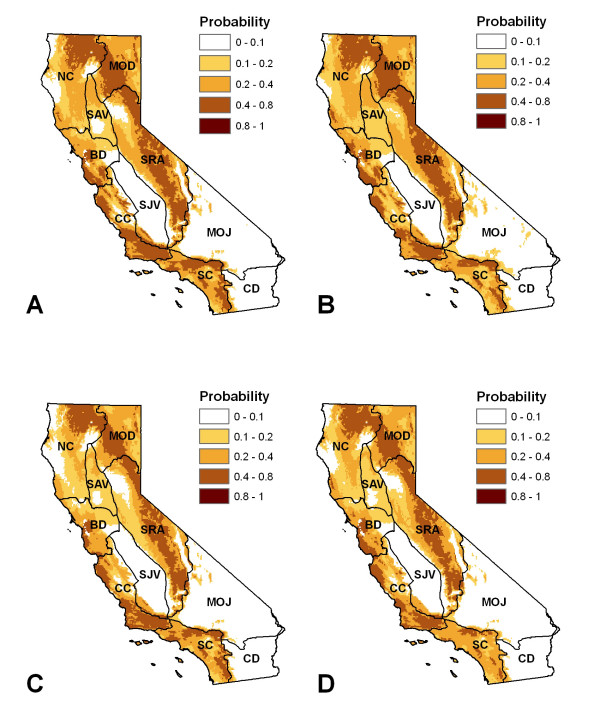
Results: Models of plague activity in California ground squirrels, based on recent climate conditions, accurately identified case locations (AUC of 0.913 to 0.948) and were significantly correlated with coyote samples. The final models were used to identify potential plague risk areas based on an ensemble of six future climate scenarios. These models suggest that by 2050, climate conditions may reduce plague risk in the southern parts of California and increase risk along the northern coast and Sierras.
Conclusion: Because different modeling approaches can yield substantially different results, care should be taken when interpreting future model predictions. Nonetheless, niche modeling can be a useful tool for exploring and mapping the potential response of plague activity to climate change. The final models in this study were used to identify potential plague risk areas based on an ensemble of six future climate scenarios, which can help public managers decide where to allocate surveillance resources. In addition, Maxent model results were significantly correlated with coyote samples, indicating that carnivore surveillance programs will continue to be important for tracking the response of plague to future climate conditions.
Figures
Similar articles
-
Multiple "spaces": Using wildlife surveillance, climatic variables, and spatial statistics to identify and map a climatic niche for endemic plague in California, U.S.A.Spat Spatiotemporal Epidemiol. 2024 Nov;51:100696. doi: 10.1016/j.sste.2024.100696. Epub 2024 Oct 16. Spat Spatiotemporal Epidemiol. 2024. PMID: 39615975
-
Annual seroprevalence of Yersinia pestis in coyotes as predictors of interannual variation in reports of human plague cases in Arizona, United States.Vector Borne Zoonotic Dis. 2011 Nov;11(11):1439-46. doi: 10.1089/vbz.2010.0196. Epub 2011 Jul 14. Vector Borne Zoonotic Dis. 2011. PMID: 21756031
-
Spatial analysis of Yersinia pestis and Bartonella vinsonii subsp. berkhoffii seroprevalence in California coyotes (Canis latrans).Prev Vet Med. 2003 Jan 15;56(4):299-311. doi: 10.1016/s0167-5877(02)00194-0. Prev Vet Med. 2003. PMID: 12507856
-
Plague studies in California: a review of long-term disease activity, flea-host relationships and plague ecology in the coniferous forests of the Southern Cascades and northern Sierra Nevada mountains.J Vector Ecol. 2010 Jun;35(1):1-12. doi: 10.1111/j.1948-7134.2010.00021.x. J Vector Ecol. 2010. PMID: 20618641 Review.
-
Yersinia pestis: examining wildlife plague surveillance in China and the USA.Integr Zool. 2012 Mar;7(1):99-109. doi: 10.1111/j.1749-4877.2011.00277.x. Integr Zool. 2012. PMID: 22405453 Review.
Cited by
-
Modeling the potential distribution of Bacillus anthracis under multiple climate change scenarios for Kazakhstan.PLoS One. 2010 Mar 9;5(3):e9596. doi: 10.1371/journal.pone.0009596. PLoS One. 2010. PMID: 20231894 Free PMC article.
-
Dengue risk assessment using multicriteria decision analysis: A case study of Bhutan.PLoS Negl Trop Dis. 2021 Feb 10;15(2):e0009021. doi: 10.1371/journal.pntd.0009021. eCollection 2021 Feb. PLoS Negl Trop Dis. 2021. PMID: 33566797 Free PMC article.
-
Improvement of disease prediction and modeling through the use of meteorological ensembles: human plague in Uganda.PLoS One. 2012;7(9):e44431. doi: 10.1371/journal.pone.0044431. Epub 2012 Sep 14. PLoS One. 2012. PMID: 23024750 Free PMC article.
-
Mapping monkeypox transmission risk through time and space in the Congo Basin.PLoS One. 2013 Sep 5;8(9):e74816. doi: 10.1371/journal.pone.0074816. eCollection 2013. PLoS One. 2013. PMID: 24040344 Free PMC article.
-
High-resolution predictive mapping for Rhipicephalus appendiculatus (Acari: Ixodidae) in the Horn of Africa.Exp Appl Acarol. 2013 Aug;60(4):531-42. doi: 10.1007/s10493-013-9670-1. Epub 2013 Feb 15. Exp Appl Acarol. 2013. PMID: 23413173
References
-
- Oyston P. Plague virulence. J Med Microbiol. 2001;50:1015–1017. - PubMed
-
- Dennis DT, Gage KL, Gratz N, Poland JD, Tikhomirov E. Plague manual: epidemiology, distribution, surveillance and control. Geneva: World Health Organization (WHO/CDS/CSR/EDC/992); 1999.
-
- CDC Human Plague – Four States, 2006. MMWR. 2006;55:940–943. - PubMed
Publication types
MeSH terms
LinkOut - more resources
Full Text Sources
Medical
