

Review
doi: 10.1016/j.pt.2009.04.005.
Epub 2009 Jun 24.
Gene copy number and malaria biology
Affiliations
- PMID: 19559648
- PMCID: PMC2839409
- DOI: 10.1016/j.pt.2009.04.005
Item in Clipboard
Review
Gene copy number and malaria biology
Trends Parasitol.
2009 Jul.
Abstract
Alteration in gene copy number provides a simple way to change expression levels and alter phenotype. This was fully appreciated by bacteriologists more than 25 years ago, but the extent and implications of copy number polymorphism (CNP) have only recently become apparent in other organisms. New methods demonstrate the ubiquity of CNPs in eukaryotes and their medical importance in humans. CNP is also widespread in the Plasmodium falciparum genome and has an important and underappreciated role in determining phenotype. In this review, we summarize the distribution of CNP, its evolutionary dynamics within populations, its functional importance and its mode of evolution.
Figures
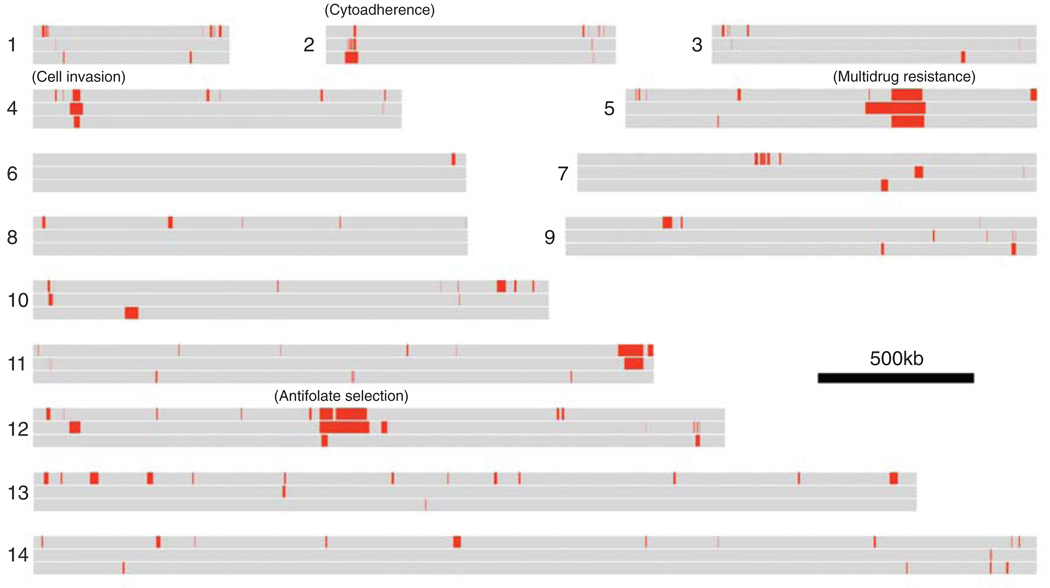
Distribution of CNP in Plasmodium falciparum. The horizontal gray bars represent the 14 chromosomes. Each chromosome is divided into three sections – top section, Jiang et al. [15]; middle section, Kidgell et al. [13]; bottom section, Ribacke et al. [14]. The red sections show regions where CNP (either loss or gain relative to the reference genome) was detected in each of the three studies. Phenotypes that are (or are suspected to be) associated with CNP are marked on the map. Note that different samples were analyzed in each study and, hence, although many common CNPs are observed, the patterns seen are not expected to be identical.
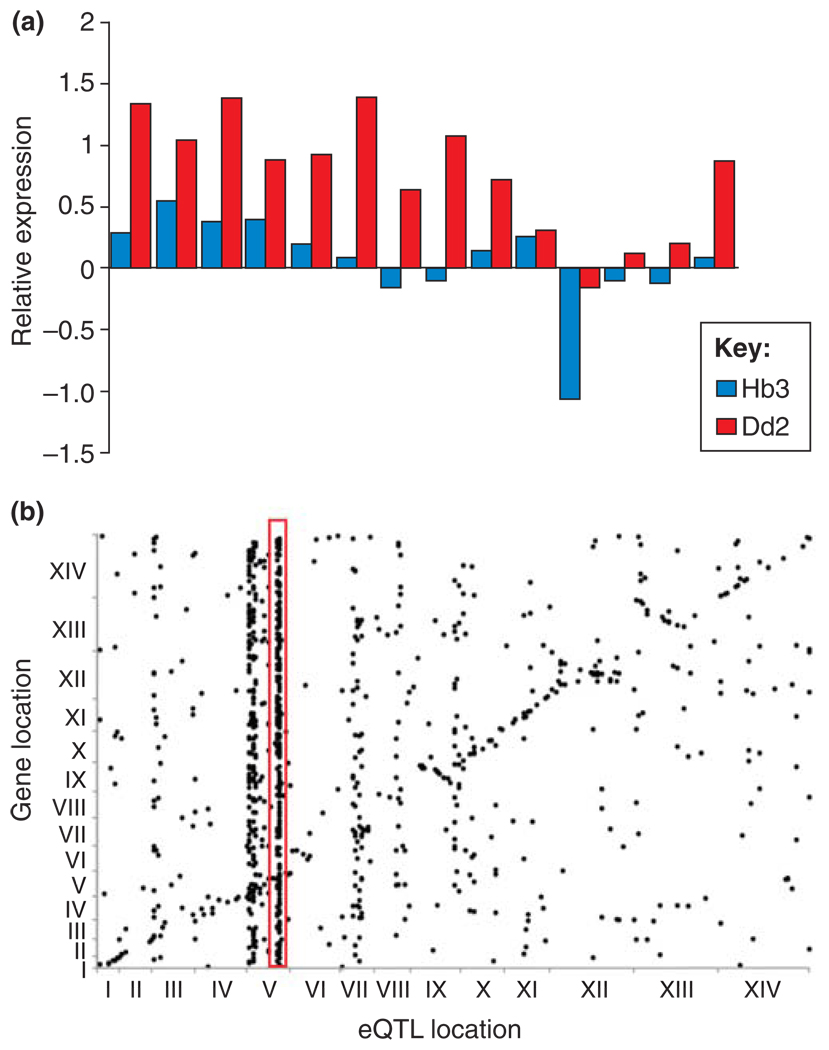
CNP and expression variation. (a) Cis regulation. The bar chart compares levels of expression (relative to 3D7) in the progeny of the HB3 × Dd2 genetic cross for 14 genes on chromosome 5. Mean expression levels in progeny inheriting this region of chromosome 5 from Dd2 and carrying multiple copies of these genes are compared with expression levels of progeny carrying a single copy of these genes inherited from Hb3. In all 14 genes, expression level is higher in progeny carrying multiple copies of these genes inherited from Dd2. These data demonstrate a strong impact of CN on local (cis) expression variation. (b) Trans regulation. The dot plot summarizes results of a linkage analysis designed to identify genome regions controlling expression phenotypes in the HB3 × Dd2 genetic cross. The genomic position of each gene for which expression was quantified is shown on the y-axis, and the genome position of the QTLs controlling expression at each gene is shown on the x-axis. The dots forming a diagonal line show genes that are under local (cis) control. However, some QTLs control expression of multiple genes in the genome. These are evident as vertical stacks of dots. The red box highlights the strong trans-regulatory QTL on chromosome 5 that co-localizes with the pfmdr1 amplicon. These data demonstrate how one CNP can dramatically alter genome-wide expression profiles. Redrawn, with permission, from data reported in Ref. [18].
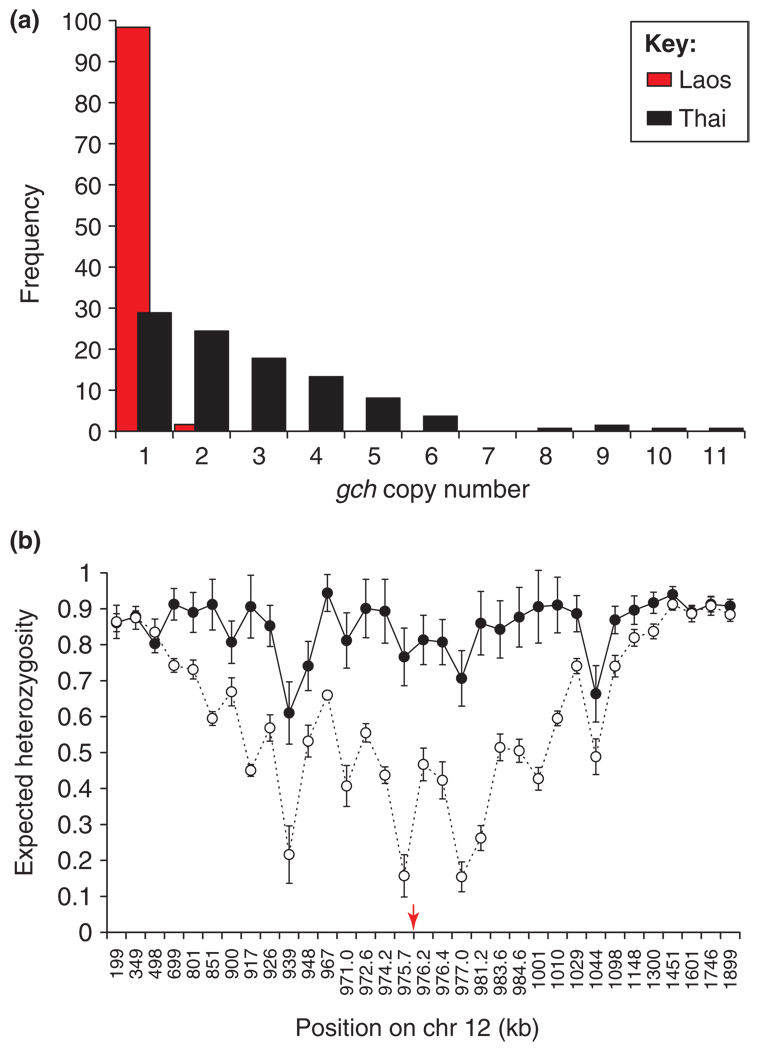
Adaptive evolution of CNP containing GTP-cyclohydrolase 1 (gch1). Patterns of genetic variation at this locus strongly suggest that it has been under strong recent selection. (a) Geographical differentiation. The bar chart shows the frequency of amplification in two neighboring countries in Southeast Asia. In comparison, SNPs show similar allele frequencies between these two locations [19,61]. (b) Genetic hitchhiking. Plot of genetic variation (y-axis), measured by expected heterozygosity (the probability of randomly drawing two different alleles) across chromosome 12 (x-axis). Genetic variation is reduced in Thailand (open circles, dotted lines) relative to Laos (closed circles, solid lines), suggesting that strong recent selection has driven the spread of chromosomes carrying multiple copies of gch1. Reproduced, with permission, from Ref. [19].
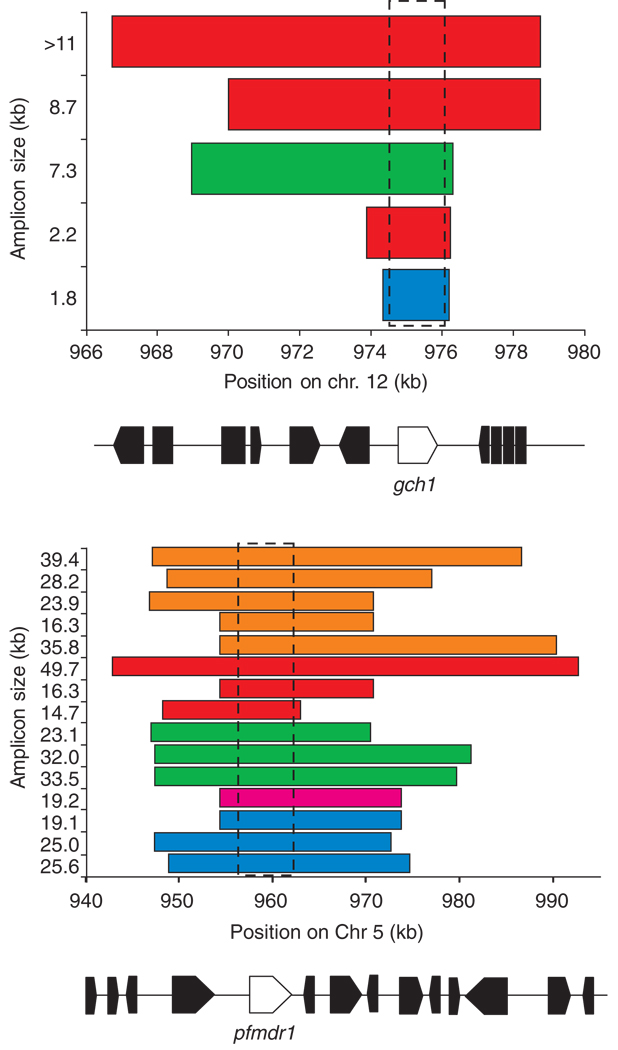
Complex evolution of CNP in P. falciparum. Bar plots show the different amplicons observed on (a) chromosome 12 and (b) chromosome 5 in parasites sampled from a single clinic on the Thailand---Burma border. The x-axis shows the span of each amplicon, and the size of each amplicon (kb) is shown on the y-axis. Gene maps of the region are shown beneath the x-axis, with gch1 and pfmdr1 shown in white and flanking genes shown in black. The amplicons are shown in different colors to show whether they have similar flanking microsatellite haplotypes, suggesting a common origin. The positions of pfmdr1 and gch1 are marked by boxes. We observed strong evidence for parallel evolution of CN amplification in both cases, as well as evidence that amplicons of different sizes share the same origins. The figure also illustrates how characterization of amplicons can effectively identify genes underlying particular phenotypes. In both cases, amplicon boundaries define a single gene --- pfmdr1 on chr 5 and gch1 on chr 12 --- that underlie adaptation to drug treatment. Adapted, with permission, from Refs [19,22].
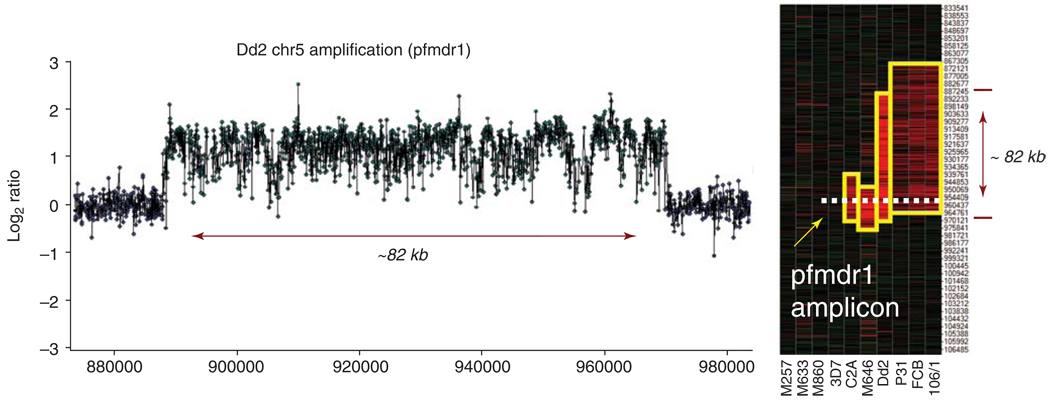
Visualizing comparative genomic hybridization data from microarrays. (a) log2 ratio (Dd2/HB3) plot for chr 5 shows a CNP in Dd2 (log2 ratio = 1.33±0.01) spanning ~82kb and including pfmdr1. (b) Signal intensities for ten isolates represented as a heatmap. The y-axis gives the position (bp) of cGH probes on chr 5. Yellow boxes highlight variable amplicon sizes. Illustrative data generated using Nimblegen-Roche microarrays.
References
-
- Cooper GM, et al. Mutational and selective effects on copy-number variants in the human genome. Nat. Genet. 2007;39:S22–S29. - PubMed
-
- Freeman JL, et al. Copy number variation: new insights in genome diversity. Genome Res. 2006;16:949–961. - PubMed
-
- McCarroll SA, Altshuler DM. Copy-number variation and association studies of human disease. Nat. Genet. 2007;39:S37–S42. - PubMed
-
- Gonzalez E, et al. The influence of CCL3L1 gene-containing segmental duplications on HIV-1/AIDS susceptibility. Science. 2005;307:1434–1440. - PubMed
Publication types
MeSH terms
Grants and funding
LinkOut - more resources
Full Text Sources
