Comparative Study
. 2009 Sep 1:1287:84-103.
doi: 10.1016/j.brainres.2009.06.061. Epub 2009 Jun 25.

Acupuncture mobilizes the brain's default mode and its anti-correlated network in healthy subjects

Affiliations
Comparative Study

Acupuncture mobilizes the brain's default mode and its anti-correlated network in healthy subjects

Kathleen K S Hui et al. Brain Res. .

Erratum in

  • Brain Res. 2010 Jan 13;1308:185

Abstract

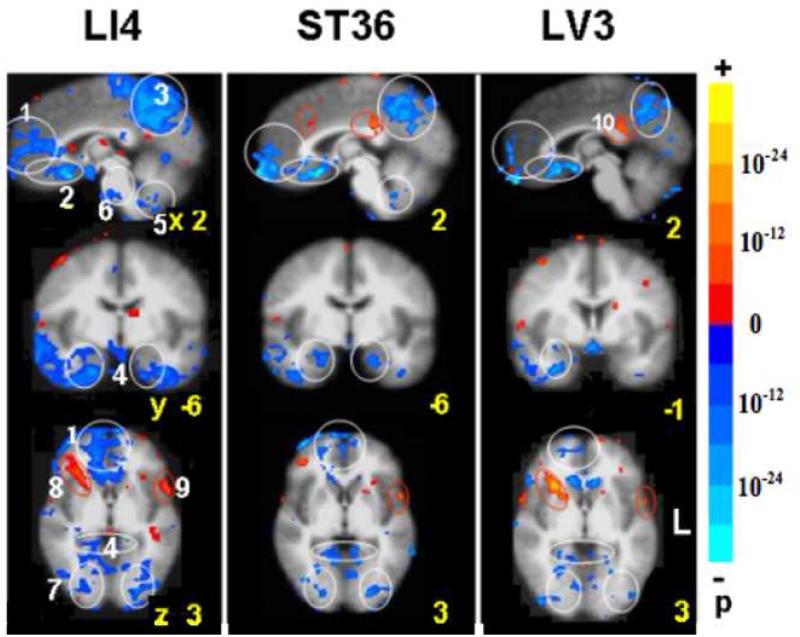
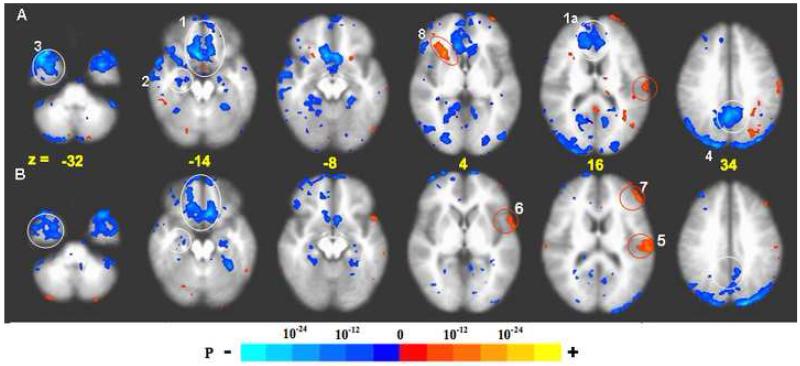
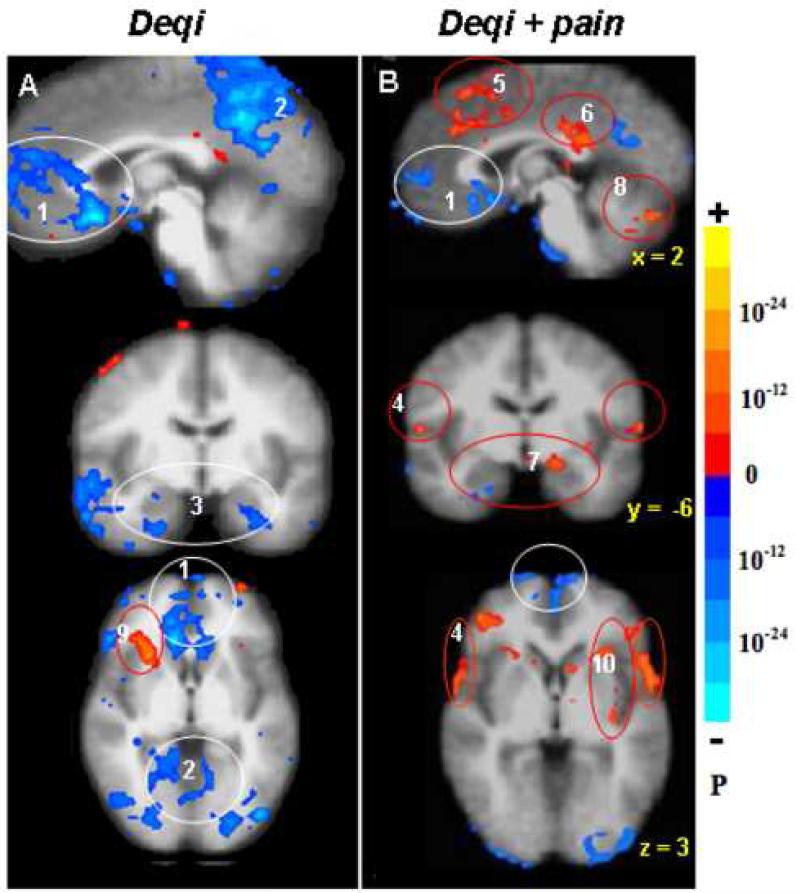
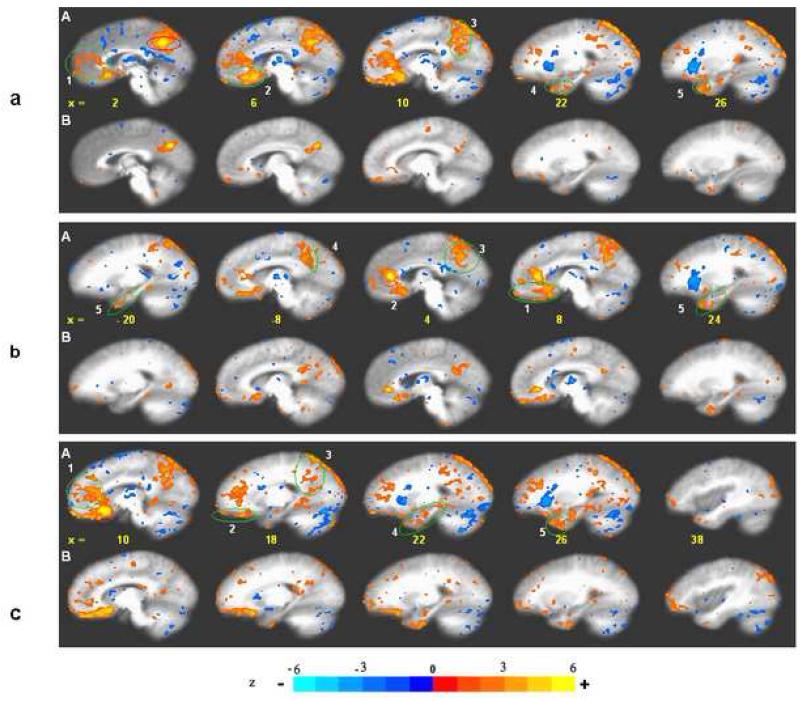
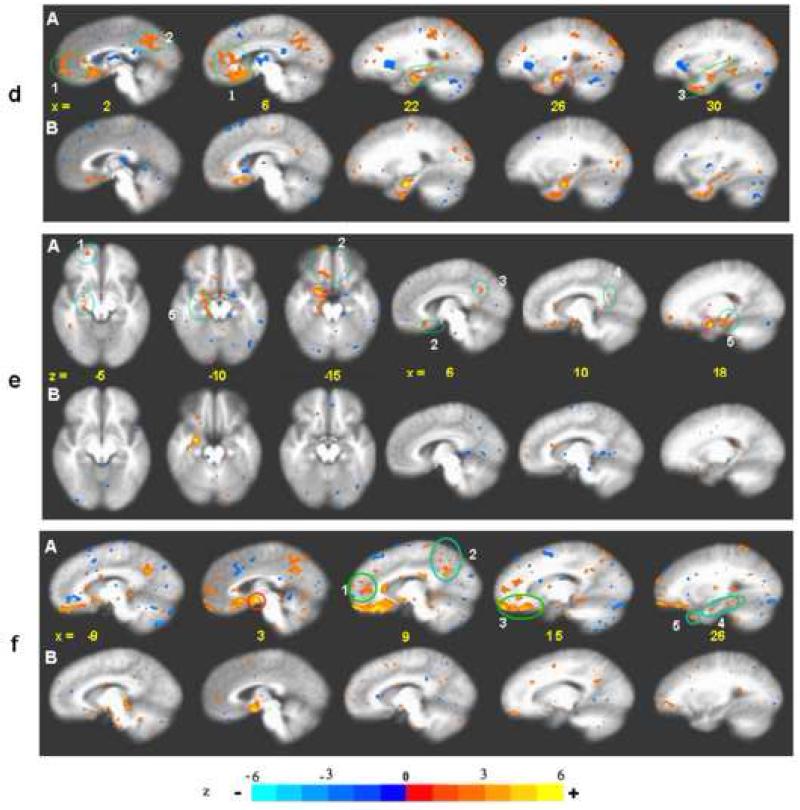
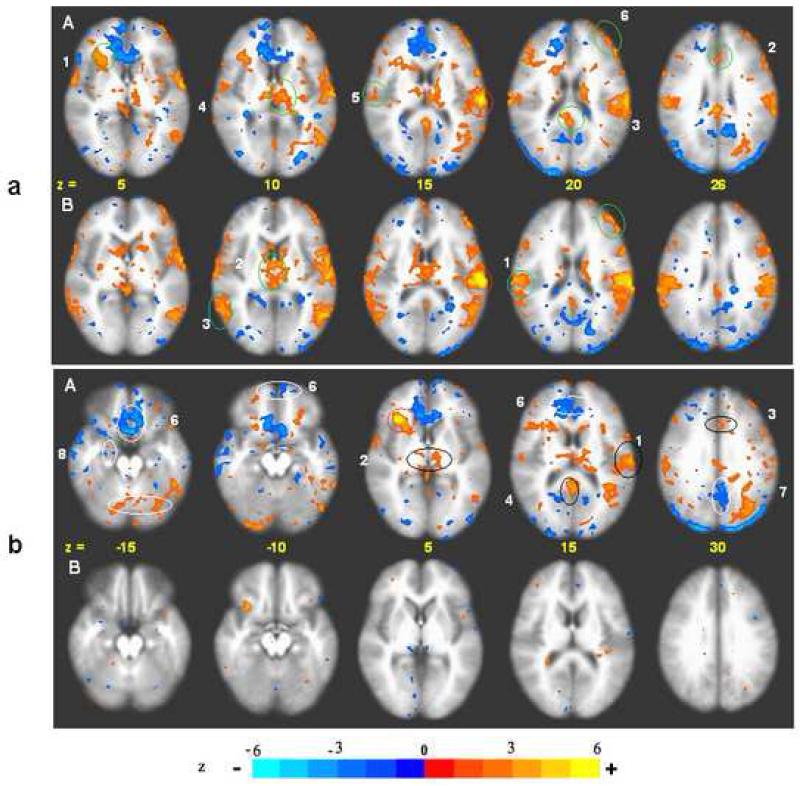
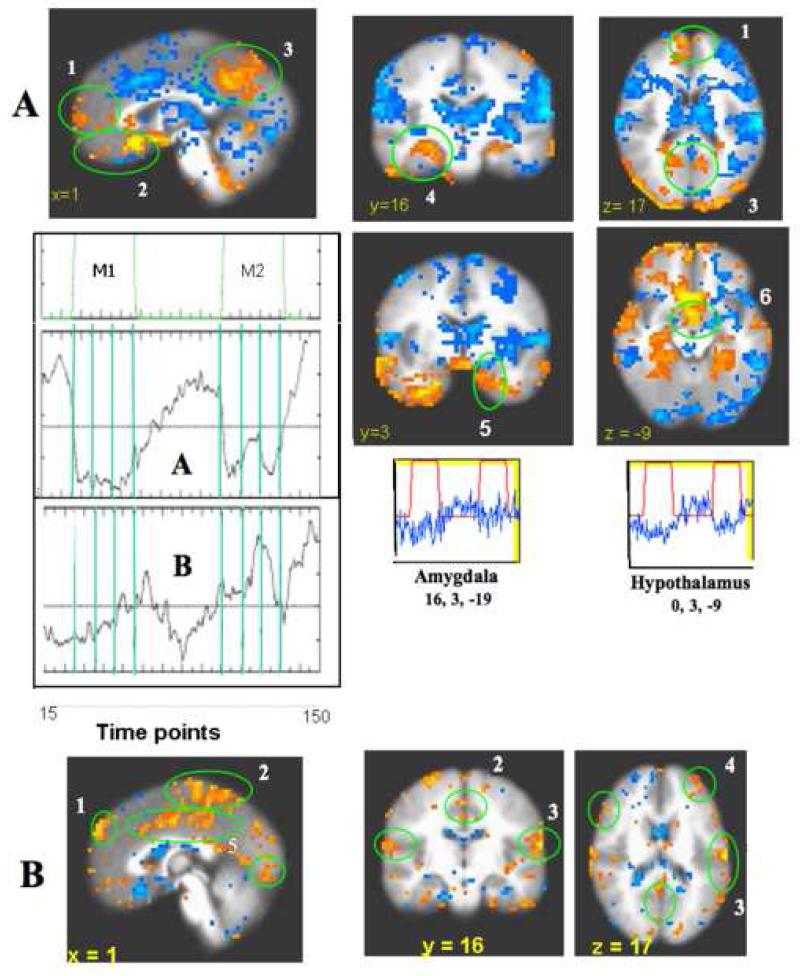
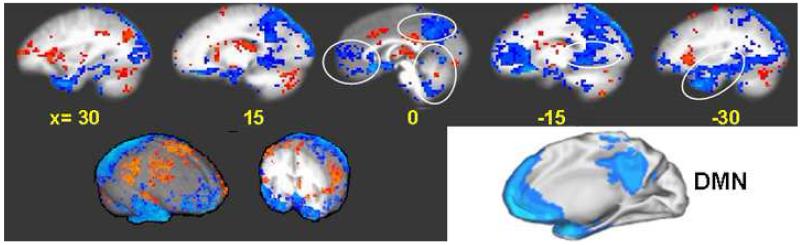
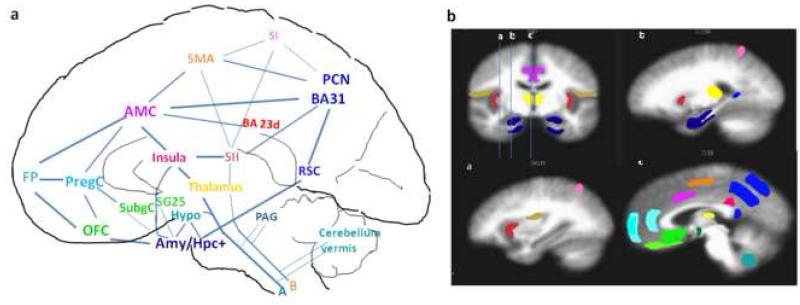
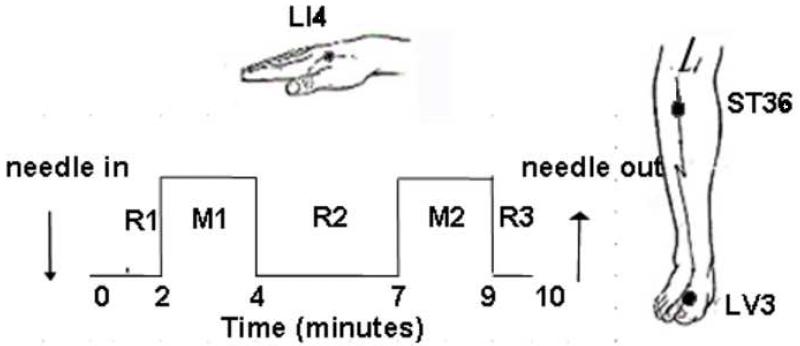
Previous work has shown that acupuncture stimulation evokes deactivation of a limbic-paralimbic-neocortical network (LPNN) as well as activation of somatosensory brain regions. This study explores the activity and functional connectivity of these regions during acupuncture vs. tactile stimulation and vs. acupuncture associated with inadvertent sharp pain. Acupuncture during 201 scans and tactile stimulation during 74 scans for comparison at acupoints LI4, ST36 and LV3 was monitored with fMRI and psychophysical response in 48 healthy subjects. Clusters of deactivated regions in the medial prefrontal, medial parietal and medial temporal lobes as well as activated regions in the sensorimotor and a few paralimbic structures can be identified during acupuncture by general linear model analysis and seed-based cross correlation analysis. Importantly, these clusters showed virtual identity with the default mode network and the anti-correlated task-positive network in response to stimulation. In addition, the amygdala and hypothalamus, structures not routinely reported in the default mode literature, were frequently involved in acupuncture. When acupuncture induced sharp pain, the deactivation was attenuated or became activated instead. Tactile stimulation induced greater activation of the somatosensory regions but less extensive deactivation of the LPNN. These results indicate that the deactivation of the LPNN during acupuncture cannot be completely explained by the demand of attention that is commonly proposed in the default mode literature. Our results suggest that acupuncture mobilizes the anti-correlated functional networks of the brain to mediate its actions, and that the effect is dependent on the psychophysical response.


Figures

Fig. 1
Fig. 1
BOLD fMRI during acupuncture at 3 acupoints performed in randomized order (LI4 64 runs/37subjects, ST36 74/43, LV3 63/37). Clusters of deactivated regions appeared at the mid and ventral levels of the MPFC (1, 2), MPC (3) and MTL (4). Deactivation also occurred in the cerebellar tonsil and vermis (5), pontine nucleus (6) and extrastriate cortex (7). The general pattern was similar for all points with differences in magnitude of signal change and preferential localizations. Robust changes in all the regions were seen with LI4. Deactivation of the FP, pregC and cerebellum was minimal with LV3. A few paralimbic regions showed activation instead: the right anterior insula (8) and the postC-BA23d (9) with LI4 and LV3. The superior temporal gyrus BA22 (10) showed activation with all points. p< 0.0001
Fig. 2
Fig. 2
BOLD response: acupuncture vs. tactile stimulation at the right LI4, ST36, and LV3 acupoints performed on the same 37 subjects, p < 0.001. Deactivation network: In acupuncture (A) extensive deactivation appeared in the MPFC (1), MTL (2), TP (3) and MPC (4) regions. In tactile stimulation (B), deactivation appeared in similar regions but was more limited in extent than in acupuncture. The difference was most marked with the FP and pregC (1a) and PCN/BA31 (4). Activation network: Activation of SII (5), BA22 (6) and DLPFC (7) was more prominent in tactile stimulation than in acupuncture. The right anterior insula (8) notably showed strong activation with acupuncture but not with tactile stimulation (For details, see also Table 1).
Fig. 3
Fig. 3
Distinct patterns of hemodynamic response between deqi (52 runs /37 subjects, A) and deqi mixed with sharp pain (52 runs/29 subjects, B) during acupuncture at right LI4, ST36 or LV3, p < 0.0001. The deactivation of the MPFC (1), MPC (2) and MTL (3) seen with deqi absent pain was attenuated in the presence of pain. With pain, activation of the sensorimotor and association cortices (4) became more prominent, and a subset of the limbic and paralimbic regions such as the midC/SMA (5), postC_BA23 (6), Amy (7), and cerebellar vermis (8) became activated. The right anterior insula (9) was markedly activated in deqi while smaller areas of anterior and posterior insula (10) were activated bilaterally in pain.
Fig. 4.1
Fig. 4.1
CCA deactivation network for acupuncture and tactile stimulation, Reference voxels are circled in red, and correlations are circled in green. p < 0.001 a) postC_BA31, right. Figure A. Acupuncture: Ref. voxel (2, −53, 36). There is extensive coherent deactivation bilaterally in the FP, pregC (l), OFC, subgC, SG25 (2) of the MPFC, the PCN, postC_BA31, 23v, RSC (3) of the MPC, the Amy, Hpc, PHpc (4) of the MTL and the TP (5). Figure B. Tactile Stimulation: Ref. voxel (3, −63, 31) Correlation regions overlap with those in acupuncture, but markedly weaker and more limited in extent. b) PregC, right. Figure A. Acupuncture: Ref. voxel (5, 34, 9) Moderate correlations with BA10 (1), VMPFC, SG25 (2); PCN, BA 31(3), RSC (4) and MTL (5) were found. Figure B. Tactile Stimulation: Ref. vox. (5, 34, −2) A similar spatial distribution but much weaker correlation than in acupuncture was found. There is insignificant correlation within pregC region and FP in midlevel MPFC; stronger correlation is found with VMPFC and subgenual areas in ventral route. c) SG25, right. Figure A. Acupuncture: Ref. voxel: (5, 17, −13) Strong correlations are found with MPFC, more extensive in the dorsal (1) than in the ventral division (2) Also strong correlations are found with PMPC (3), MTL (4), and TP (5). Figure B. Tactile Stimulation: Ref. voxel (5, 14, −12) Correlations are seen with similar regions but weaker than in acupuncture. SG25 shows the strongest functional connectivity among the regions tested for the deactivation network in tactile stimulation. d) Hpc, right. Figure A. Acupuncture: Ref. voxel (25, −11, −16). Correlations with MPFC (1), MPC (2) and other TL structures (3) are more limited in extent than with the use of other reference regions from the MPFC or MPC. Figure B. Tactile stimulation: Ref. voxel: (23, −10, −19) Correlations are found in similar regions as in acupuncture, but markedly reduced in extent with only focal correlation in MPC. e) Amy, right. Figure A. Acupuncture: Ref. voxel (20, 2, −16). Correlations are seen with the FP (1), VMPFC (2), PCN/postC_BA31 of the MPC (3), RSC (4), Hpc/PHpc (5). Figure B. Tactile Stimulation: No significant signal change or regional correlations were found. f) Hypothalamus, right. Figure A. Acupuncture: Ref. voxel (3, −1, −10) Correlations are seen with the FP, pregC (1), PCN, PCC (2) subgC, VMPFC, SG25 (3), Amy, Hpc, PHpc, TP (4) Figure B. Tactile Stimulation: Ref voxel (3, −1, −10) No significant signal change or regional correlations were found.
Fig. 4.1
Fig. 4.1
CCA deactivation network for acupuncture and tactile stimulation, Reference voxels are circled in red, and correlations are circled in green. p < 0.001 a) postC_BA31, right. Figure A. Acupuncture: Ref. voxel (2, −53, 36). There is extensive coherent deactivation bilaterally in the FP, pregC (l), OFC, subgC, SG25 (2) of the MPFC, the PCN, postC_BA31, 23v, RSC (3) of the MPC, the Amy, Hpc, PHpc (4) of the MTL and the TP (5). Figure B. Tactile Stimulation: Ref. voxel (3, −63, 31) Correlation regions overlap with those in acupuncture, but markedly weaker and more limited in extent. b) PregC, right. Figure A. Acupuncture: Ref. voxel (5, 34, 9) Moderate correlations with BA10 (1), VMPFC, SG25 (2); PCN, BA 31(3), RSC (4) and MTL (5) were found. Figure B. Tactile Stimulation: Ref. vox. (5, 34, −2) A similar spatial distribution but much weaker correlation than in acupuncture was found. There is insignificant correlation within pregC region and FP in midlevel MPFC; stronger correlation is found with VMPFC and subgenual areas in ventral route. c) SG25, right. Figure A. Acupuncture: Ref. voxel: (5, 17, −13) Strong correlations are found with MPFC, more extensive in the dorsal (1) than in the ventral division (2) Also strong correlations are found with PMPC (3), MTL (4), and TP (5). Figure B. Tactile Stimulation: Ref. voxel (5, 14, −12) Correlations are seen with similar regions but weaker than in acupuncture. SG25 shows the strongest functional connectivity among the regions tested for the deactivation network in tactile stimulation. d) Hpc, right. Figure A. Acupuncture: Ref. voxel (25, −11, −16). Correlations with MPFC (1), MPC (2) and other TL structures (3) are more limited in extent than with the use of other reference regions from the MPFC or MPC. Figure B. Tactile stimulation: Ref. voxel: (23, −10, −19) Correlations are found in similar regions as in acupuncture, but markedly reduced in extent with only focal correlation in MPC. e) Amy, right. Figure A. Acupuncture: Ref. voxel (20, 2, −16). Correlations are seen with the FP (1), VMPFC (2), PCN/postC_BA31 of the MPC (3), RSC (4), Hpc/PHpc (5). Figure B. Tactile Stimulation: No significant signal change or regional correlations were found. f) Hypothalamus, right. Figure A. Acupuncture: Ref. voxel (3, −1, −10) Correlations are seen with the FP, pregC (1), PCN, PCC (2) subgC, VMPFC, SG25 (3), Amy, Hpc, PHpc, TP (4) Figure B. Tactile Stimulation: Ref voxel (3, −1, −10) No significant signal change or regional correlations were found.
Fig. 4.2
Fig. 4.2
CCA: Acupuncture vs. tactile stimulation, Activation network. p < 0.001 a) SII, left (contralateral) Figure A. Acupuncture: Ref. voxel (−59, −20, 17). Correlations are seen with the right anterior insula (1), ant-midC (2). postC_BA23d (3), thalamus (4), ipsilateral SII (5), DLPFC_BA46 (6). Figure B. Tactile stimulation: Ref. voxel (−59, −21, 16). Correlations are seen with ipsilateral SII (1), thalamus (2), lateral temporal association cortex (3), DLPFC BA46 (4), stronger than in acupuncture, but no significant correlation with right anterior insula and midC. b) Anterior Insula, right. Figure A. Acupuncture: Ref voxel (32, 26, 6). Positive correlations (circled in black) are seen with SII (1), thalamus (2), midC (3), postC_BA23 (4), BA22 (5). Negative correlations (circled in white) are seen with MPFC (BA10/32/24/11/25) (6), MPC (BA31/7) (7), MTL (Hpc, PHpc) (8). Figure B. Tactile stimulation: Ref voxel (32, 26, 6). No significant signal change or regional correlations were found.
Fig. 5
Fig. 5
Functional connectivity by pICA. Acupuncture at right LI4, ST36 and LV3 in 201 runs on 48 subjects. Time courses derived from pICA are shown for both Deactivation (A) and Activation (B) networks. In addition, the time-course for voxels within the Amy and Hypothalamus from our initial dataset are shown. A. Deactivation network. p < 0.0001: The clusters of deactivated regions in the MPFC (1, 2), MPC (3), and MTL (4, 5) and the Hypo (6) were almost identical in temporal and spatial characteristics to standard GLM and CCA analysis methods. The Amy (5) was involved. B. Activation network. p < 0.005: Prominent coherent activation occurred in the sensorimotor and association cortices such as the antero-DMPFC (1), SMA/paracentral lobule (2), SII (3), DLPFC (4), and midC/postC_BA23d (5) are shown. Correlation is seen across hemispheres. ICA was used for generalized trend and pattern across-checking purposes, not primary analyses. The colors follow general trends with reds-yellows representing increasing positive correlation and blues (dark-light) representing increasing anti-correlation.
Fig. 6
Fig. 6
Overlap between the LPNN deactivation network in acupuncture by GLM analysis show virtually identical patterns with the DMN. The cortico-limbic response in the MPFC (1), PMPC (2), RSC (3) MTL (4) and cerebellar vermis converge with each other. Synthesis of the regions of correlated deactivation exhibits a view that is remarkably similar to the DMN described for the human brain (Schulman et al 1977). p < 0.0001. 3-D views of brain surface and a coronal section through the anterior commissure during acupuncture at right LI4, ST36 and LV3 on 37 subjects exhibit extensive deactivation of the prefrontal, posterior parietal and temporal lobes (encoded in blue) coupled with moderate activation of the sensorimotor cortices and thalamus (encoded in red).
Fig. 7
Fig. 7
Functionally anticorrelated brain networks involved in acupuncture action. In the schematic diagram of a mid-sagittal section (Fig a), deactivated regions are color-coded in cool colors (blue/green) and activated regions in warm colors (red, etc) The areas corresponding to those in the schematic diagram are shown in the MRI sections in Fig b, a coronal slice through the amygdala and 3 sagittal slices as indicated on the coronal section. Regions of deactivation in the limbic-paralimbic-neocortical network (LPNN) aggregate in the medial prefrontal cortex { frontal pole (FP), pregenual and subgenual cingulate (pregC, subgC), subgenual area (SG25), orbitofrontal cortex (OFC)}, medial parietal cortex {precuneus (PCN), post-cingulate_ BA31) }, retrosplenial cortex (RSC)_BA29,30, and medial temporal lobe {amygdala (Amy), hippocampal formation (Hpc+), located lateral to the schematic section}. The hypothalamus, pontine nuclei and cerebellar vermis also showed deactivation. The SII, right anterior insula, antero-middle cingulate (AMC), supplementary motor area (SMA), posterior cingulate_BA23 dorsal, and sensory divisions of the thalamus comprise the activation network. Several associated cortical areas and the basal ganglia showing activation or deactivation are not shown. The figure is partly adapted from Apkarian’s figure on pain perception and regulation (Apkarian et al., 2005)
Fig. 8
Fig. 8
Acupoints and time-course paradigm. Manual acupuncture was administered to the LI4, ST36 and LV3 acupoints on the right side, acquiring duplicate scans on each acupoint. The needle remained in place at R1, R2 and R3 (2, 3, 1 minute respectively) and rotated with even motion for 2 min at the rate of 60 times per minute during M1 and M2. The needle was left in place during the sensations interview before starting the second scan. The procedure on each acupoint lasted about 25 min. Tactile stimulation was delivered to the acupoint with a size 5.88 von Frey monofilament using a matched paradigm.

References

    1. Anand A, Li Y, Wang Y, Gardner K, Lowe MJ. Reciprocal effects of antidepressant treatment on activity and connectivity of the mood regulating circuit: an FMRI study. J Neuropsychiatry Clin Neurosci. 2007;19(3):274–82. - PMC - PubMed
    1. Apkarian AV, Bushnell MC, Treede Rolf-Detlef, Zubieta Jon-Kar. Human brain mechanisms of pain perception and regulation in health and disease. Eur J Pain. 2005;9:463–484. - PubMed
    1. Beckmann CF, DeLuca M, Devlin JT, Smith SM. Investigations into resting-state connectivity using independent component analysis. Philos Trans R Soc Lond B Biol Sci. 2005;360(1457):1001–13. - PMC - PubMed
    1. Beckmann CF, Smith SM. Probabilistic independent component analysis for functional magnetic resonance imaging. IEEE Trans Med Imaging. 2004;23(2):137–52. - PubMed
    1. Beckmann CF, Smith SM. Tensorial extensions of independent component analysis for multisubject FMRI analysis. Neuroimage. 2005;25(1):294–311. - PubMed

Publication types