Comparative Study
. 2009 Nov 1;48(2):371-80.
doi: 10.1016/j.neuroimage.2009.06.043. Epub 2009 Jun 25.

A comparison between voxel-based cortical thickness and voxel-based morphometry in normal aging

Affiliations
Comparative Study

A comparison between voxel-based cortical thickness and voxel-based morphometry in normal aging

Chloe Hutton et al. Neuroimage. .

Abstract

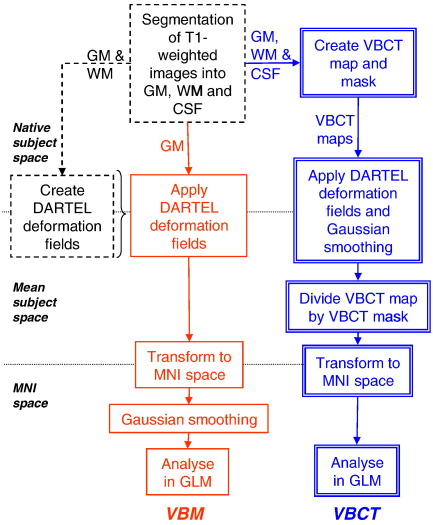
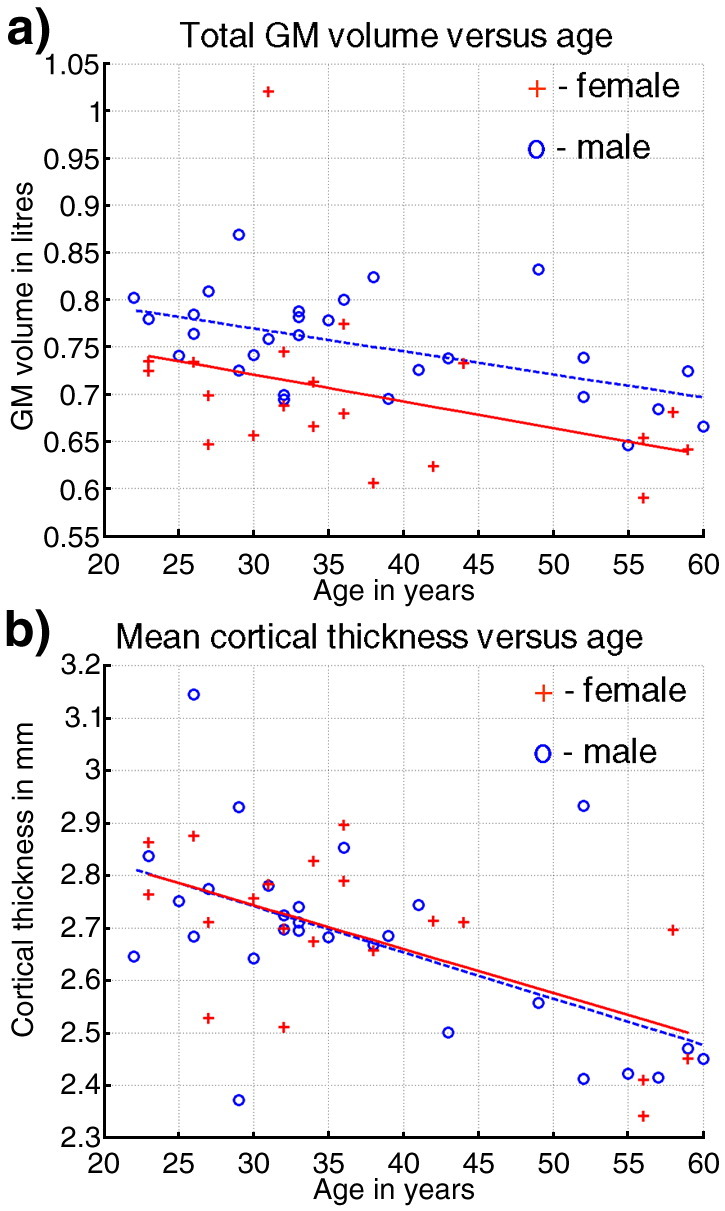
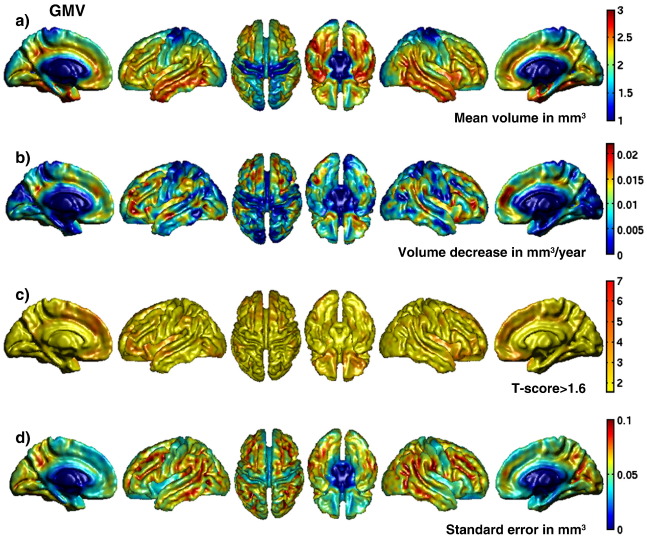
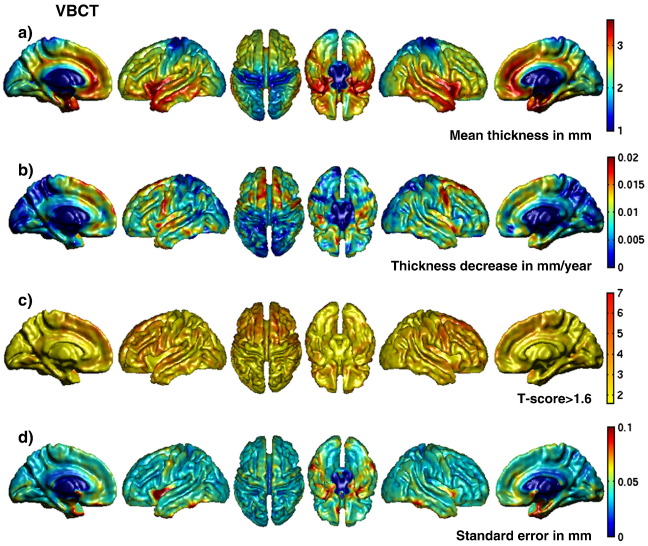
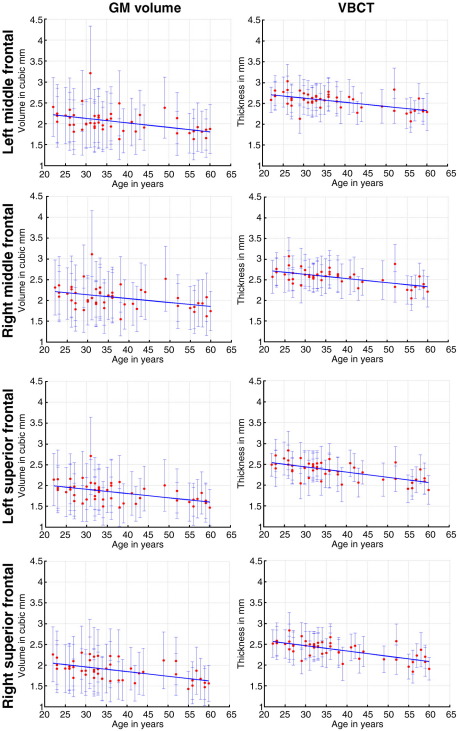
The morphology of cortical grey matter is commonly assessed using T1-weighted MRI together with automated computerised methods such as voxel-based morphometry (VBM) and cortical thickness measures. In the presented study we investigate how grey matter changes identified using voxel-based cortical thickness (VBCT) measures compare with local grey matter volume changes identified using VBM. We use data from a healthy aging population to perform the comparison, focusing on brain regions where age-related changes have been observed in previous studies. Our results show that overall, in healthy aging, VBCT and VBM yield very consistent results but VBCT provides a more sensitive measure of age-associated decline in grey matter compared with VBM. Our findings suggest that while VBCT selectively investigates cortical thickness, VBM provides a mixed measure of grey matter including cortical surface area or cortical folding, as well as cortical thickness. We therefore propose that used together, these techniques can separate the underlying grey matter changes, highlighting the utility of combining these complementary methods.


Figures

Fig. 1
Fig. 1
Overview of data processing steps used for the VBM and VBCT analysis. (See Methods section for details). VBM steps are indicated by a solid line (red), VBCT steps are indicated by a double line (blue) and steps common to both are indicated by a dotted line (black).
Fig. 2
Fig. 2
Global effects of age on the brain. (a) Total GM volume in litres versus age. (b) Mean cortical thickness in mm versus age. Females = ‘+’, males = ‘o’. The solid and dotted lines shows the linear regression of age on the data for females and males respectively.
Fig. 3
Fig. 3
Regional effects of age on local GM volume rendered onto surface of spatially normalised grey matter. (a) Mean local GM volume in mm3. (b) Decrease in local GM volume in mm3 per year. (c) Voxel-wise T-scores for decrease in local GM volume with age, (T-score > 1.6, corresponding to a descriptive P-value threshold of P < 0.05). (d) Voxel-wise standard error (in mm3) calculated from the square root of the sum of the squares of the difference between the full fitted model and the GM volume data divided by the number of degrees of freedom. Although sub-cortical regions are visible in the medial and inferior views these were not included in the analyses and have therefore been set to the minimum value on the colour scale.
Fig. 4
Fig. 4
Regional effects of age on VBCT rendered onto surface of spatially normalised grey matter. (a) Mean VBCT in mm. (b) Decrease in VBCT in mm per year. (c) Voxel-wise T-scores for decrease in VBCT with age, (T-score > 1.6, corresponding to a descriptive P-value threshold of P < 0.05). (d) Voxel-wise standard error (in mm) calculated from the square root of the sum of the squares of the difference between the full fitted model and the VBCT data divided by the number of degrees of freedom. Although sub-cortical regions are visible in the medial and inferior views these were not included in the analyses and have therefore been set to the minimum value on the colour scale.
Fig. 5
Fig. 5
Effect of age on local GM volume (in mm3, left column) and VBCT (in mm, right column) in left and right middle frontal and left and right superior frontal areas. The dots show the mean and the errorbars show the standard deviation (not corrected for spatial correlations) of the local GM or VBCT within the ROI for each subject. The solid lines show the linear regression of age on the data within the cluster.

References

    1. Aleman-Gomez, Y., Melie-Garcia, L., Valdes-Hernandez, P., 2006. Toolbox for automatic parcellation of brain structures. 12th Annual OHBM, Florence, Italy.
    1. Ashburner J. A fast diffeomorphic image registration algorithm. NeuroImage. 2007;38:95–113. - PubMed
    1. Ashburner J., Friston K.J. Nonlinear spatial normalization using basis functions. Hum. Brain Mapp. 1999;7:254–266. - PMC - PubMed
    1. Ashburner J., Friston K.J. Voxel-based morphometry—the methods. NeuroImage. 2000;11:805–821. - PubMed
    1. Ashburner J., Friston K.J. Unified segmentation. NeuroImage. 2005;26:839–851. - PubMed

Publication types