. 2009 Jun 26;34(6):767-74.
doi: 10.1016/j.molcel.2009.05.027.

Shifts in replication timing actively affect histone acetylation during nucleosome reassembly

Affiliations

Shifts in replication timing actively affect histone acetylation during nucleosome reassembly

Laura Lande-Diner et al. Mol Cell. .

Abstract

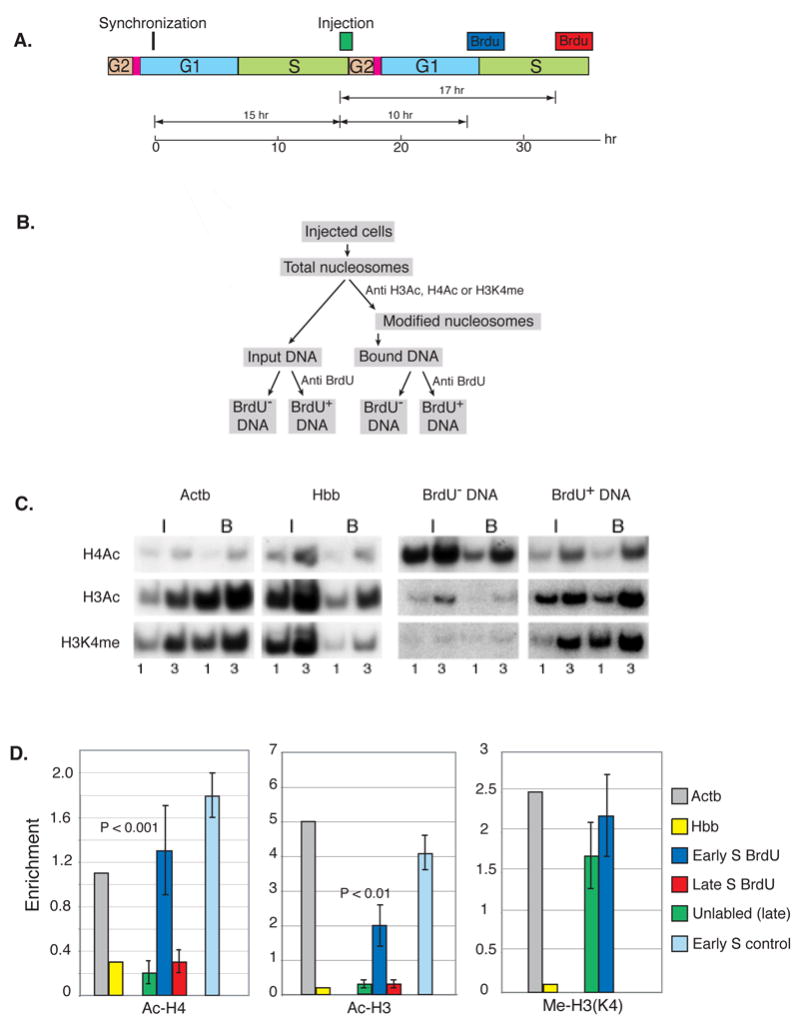
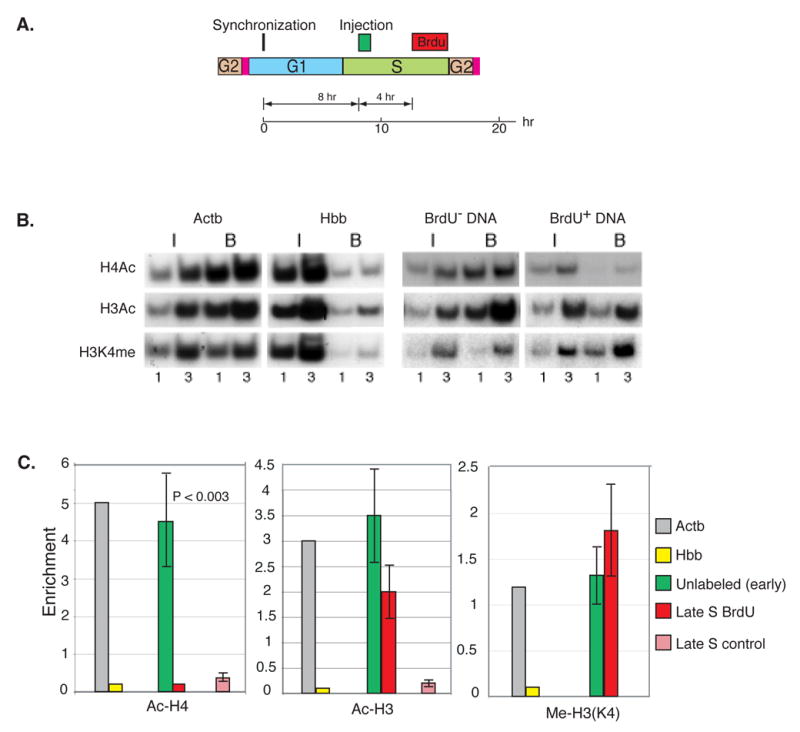
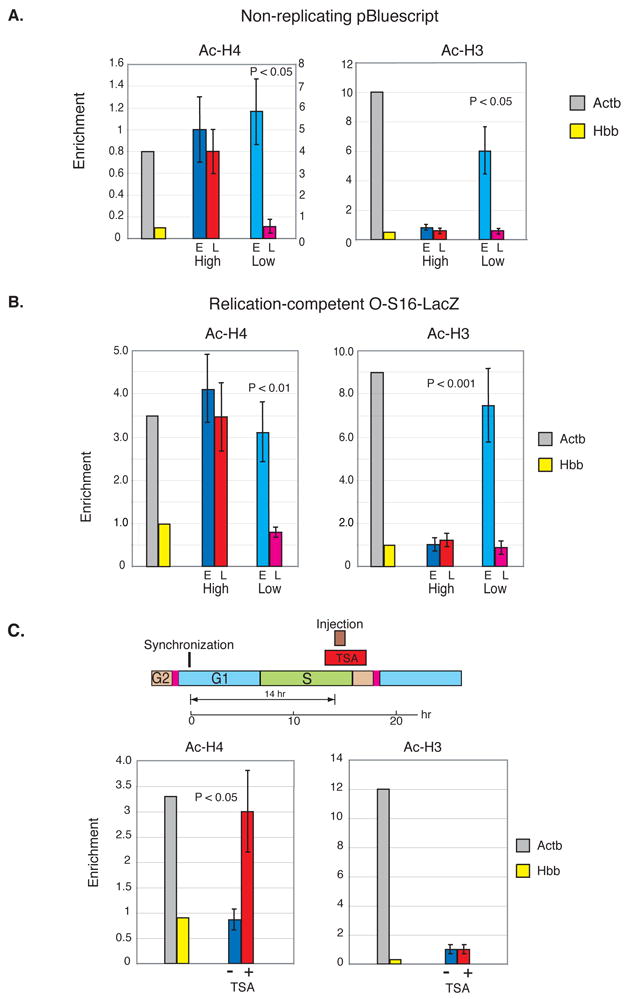
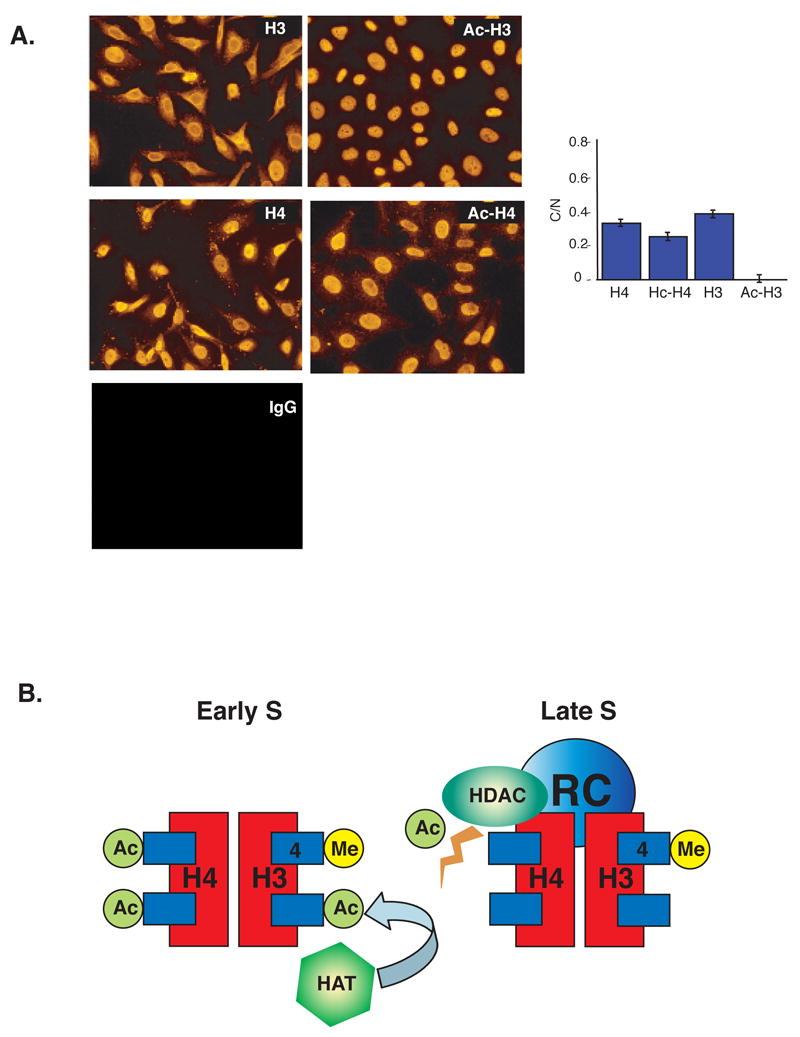
The entire genome is replicated in a programmed manner, with specific regions undergoing DNA synthesis at different times in S phase. Active genes generally replicate in early S phase, while repressed genes replicate late, and for some loci this process is developmentally regulated. Using a nuclear microinjection system, we demonstrate that DNA sequences originally packaged into nucleosomes containing deacetylated histones during late S become reassembled with acetylated histones after undergoing replication in early S. Conversely, a change from early to late replication timing is accompanied by repackaging into nucleosomes containing deacetylated histones. This is carried out by differential cell-cycle-controlled acetylation and deacetylation of histones H3 and H4. These studies provide strong evidence that switches in replication timing may play a role in the regulation of nucleosome structure during development.


Figures

Figure 1
Figure 1. Late to early replication switch
A. Replication competent Rat-1 cells were synchronized by mitotic shake off, injected (about 1000 cells per experiment) after 15 hr (late S) with O-S16–LacZ (0.75 ng/ml) and labeled with BrdU (10−5 M) either after 10 hr during early S or after 17 hr in late S phase of the following cycle (see diagram). B. After 3 hr, nucleosomes were prepared and immunoprecipitated with anti Ac-H4, anti Ac-H3 or anti Me-H3(K4). DNA from both input and bound samples was then separated into BrdU-labeled (37%) and unlabeled fractions by immunoprecipitation with anti-BrdU antibodies. C. These fractions were subjected to semi-quantitative PCR at several different concentrations (1X, 3X) using primers specific for the injected DNA in the presence of radioactive dCTP. Resulting products were separated by PAGE, visualized by autoradiography and then quantitated by scanning. The quantities used for analysis were adjusted to ensure they remain in the linear range. Positive (Actb) and negative (Hbb) controls were also analyzed. The results shown in this example were all derived from a single injection experiment. D. Histone enrichment levels (B/I) for both BrdU labeled (early replicating, blue; late replicating, red) and unlabeled (green) DNA are shown in the bar graph together with positive Actb (grey) and negative Hbb (yellow) ChIP controls. As a control (light blue), 0-S16-LacZ was injected directly into early S phase, and after 3 hr, nucleosomes were isolated and subjected to ChIP analysis. Replicating molecules were singled out by digestion with DpnI prior to PCR analysis. B/I levels were then normalized against the positive and negative controls. The ChIP results for Ac-H4 and Ac-H3 are presented with their standard deviations. P values (two-tailed student T test) for the difference between unreplicated (green) and replicated (blue) molecules are shown. These results were calculated as a composite from 3 individual injection experiments (as in C) after being normalized to the positive control.
Figure 2
Figure 2. Early to late replication switch
A. Replication-competent Rat-1 cells were synchronized by mitotic shake off, injected (about 1000 cells per experiment) after 8 hr (early S) with O-S16–LacZ (0.75 ng/ml) and labeled with BrdU (10−5 M) in late S (beginning 4 hr after injection). Nucleosomes were prepared 3 hr after the start of labeling and immunoprecipitated with anti Ac-H4, anti Ac-H3 or anti Me-H3(K4). DNA from both input and bound samples was then separated into BrdU-labeled (red) (41%) and unlabeled (green) fractions by immunoprecipitation with anti-BrdU antibodies. B. These samples were analyzed by semi quantitative PCR. C. Histone enrichment levels (B/I ± SEM) for both BrdU labeled (replicated) and unlabeled (unreplicated) DNA are shown in the bar graph together with the enrichment levels of the positive (Actb, grey) and negative (Hbb, yellow) controls and the P value for each experiment. As a control (light red), O-S16-LacZ was injected directly into late S phase and after 3 hr nucleosomes were isolated and subjected to ChIP analysis. Replicating molecules were singled out by digestion with DpnI prior to PCR analysis. The ChIP results from 2 individual injection experiments have been normalized against the positive and negative controls. P values were calculated by the two-tailed students T test.
Figure 3
Figure 3. Differential histone H3 and H4 acetylation
A. High (7.5 ng/ml) or low (0.75 ng/ml) concentrations of non-replicating DNA were injected into Rat-1 cells (500 each) during early (blue) and late (red) S phase after mitotic-shakeoff synchronization. We injected two different pBluescript plasmids, which differ from each other by a small deletion. In each experiment, one plasmid was injected into cells in early S, while the other was injected into late S cells. Nucleosomes from both cell populations were collected 3 hr after injection and then combined for ChIP analysis using anti-Ac-H4, anti-Ac-H3 or anti Me-H3(K4). Enrichment (B/I ± SEM) levels and P values (two-tailed students T test) for the results of 2 individual injection experiments are shown in the bar graph. Actb (grey) serves as a positive and Hbb (yellow) as a negative control. For Ac-H4, these controls were taken from the high concentration experiment. In the low concentration experiment, Actb had an enrichment level of 4 as compared to that of Hbb (0.8), and for this reason the results are shown with its own scale (right y-axis). For Ac-H3, the Actb control showed an enrichment of 10 in both the high and low experiments. B. High (7.5 ng/ml) or low (0.75 ng/ml) concentrations of O-S16-LacZ DNA were injected into replication-competent Rat-1 cells (500 each) during early (blue) or late (red) S phase after mitotic-shakeoff synchronization. Nucleosomes were collected 3 hr after injection and subjected to ChIP analysis using Anti-Ac-H4 or anti-Ac-H3. Replicated molecules were assayed by digestion with DpnI before PCR. Actb (grey) serves as a positive and Hbb (yellow) as a negative control in each injection experiment and the results were then adjusted by equalizing the relative enrichment of Actb to the early S high concentration injection. Enrichment levels (B/I ± SEM) for the results of 2 individual injection experiments are shown together with the P value for the difference between low-concentration early and late injected DNA (students T-test). C. Rat-1 cells were synchronized by mitotic shake-off and then injected (700 cells) with pBluescript (0.75 ng/ml) in late S in the presence or absence of the HDAC inhibitor TSA (50 ng/ml) that was added for an hour prior to injection (Diagram). Nucleosomes were prepared from cells after 4 hr and immunoprecipitated with anti Ac-H4 or Ac-H3. Untreated (blue) and TSA treated (red) enrichment levels (B/I ± SEM) from 2 individual injection experiments as determined by semiquantitative PCR on input and bound fractions are shown in the bar graph together with positive Actb (grey) and negative Hbb (yellow) controls from untreated cells. P values were calculated using the two-tailed students T test. In TSA treated cells, the ratio of Actb/Hbb enrichment was reduced to about 50% of that shown in the figure. It should be noted that a 24 hr treatment at this concentration of TSA has been shown to bring about extensive histone acetylation at endogenous loci (Hashimshony et al., 2003).
Figure 4
Figure 4. Model for histone acetylation during replication in early and late S
A. Localization of histone acetylation. Unsynchronized HeLa Cells were fixed, permeabilized and stained with various histone antibodies as described (Experimental Procedures). The panels show results using anti-H3, anti-H4, anti-AcH3, anti-AcH4 and an IgG control. The histogram shows micrometric quantification (± SD) of total intensity in the cytoplasm relative to the nucleus (C/N). This analysis was carried out over the linear range of intensities. Background was determined by carrying out the same procedure using IgG instead of the primary antibodies. In most cases, the level of background fluorescence was negligible (< 1%) as compared to the levels obtained with specific antibodies. In the case of AcH3, we obtained an average specific intensity reading of 0.42 for the cytoplasm and 26.1 for the nucleus, with a background level of 0.18. Since the average area of the cytoplasm is about 2 fold greater than that of the nucleus, the relative intensity (C/N) is calculated as 2•(0.42 – 0.18)/(26.1 – 0.18) = 0.019 with a standard deviation of ± 0.005. Note the low relative amount of AcH3 in the cytoplasm as compared to AcH4 (P<0.0001). B. In early S, histone H3 becomes actively acetylated by HATs prior to assembly on newly replicated DNA. Histone H4 is already pre-acetylated before entering the nucleus and is therefore not affected by this process. In late S, this acetylation machinery is not present, but histone H4 becomes actively deacetylated by HDACs that are probably present in the replication complex (RC) itself. Methylation of histone H3K4 is present in nucleosomes assembled both in early and late S phase.

References

    1. Allshire R, Bickmore W. Pausing for thought on the boundaries of imprinting. Cell. 2000;102:705–708. - PubMed
    1. Azuara V, Brown KE, Williams RR, Webb N, Dillon N, Festenstein R, Buckle V, Merkenschlager M, Fisher AG. Heritable gene silencing in lymphocytes delays chromatid resolution without affecting the timing of DNA replication. Nature Cell Biol. 2003;5:668–674. - PubMed
    1. Brandeis M, Hunt T. The proteolysis of mitotic cyclins in mammalian cells persists from the end of mitosis until the onset of S phase. EMBO J. 1996;15:5280–5289. - PMC - PubMed
    1. Brown DD. The role of stable complexes that repress and activate eucaryotic genes. Cell. 1984;37:359–365. - PubMed
    1. Consortium TEP. Identification and analysis of functional elements in 1% of the human genome by the ENCODE pilot project. Nature. 2007;447:799–816. - PMC - PubMed

Publication types

LinkOut - more resources