. 2009 Oct;168(1):190-9.
doi: 10.1016/j.jsb.2009.06.015. Epub 2009 Jun 26.

DNA-tethered membranes formed by giant vesicle rupture

Affiliations

DNA-tethered membranes formed by giant vesicle rupture

Minsub Chung et al. J Struct Biol. 2009 Oct.

Abstract

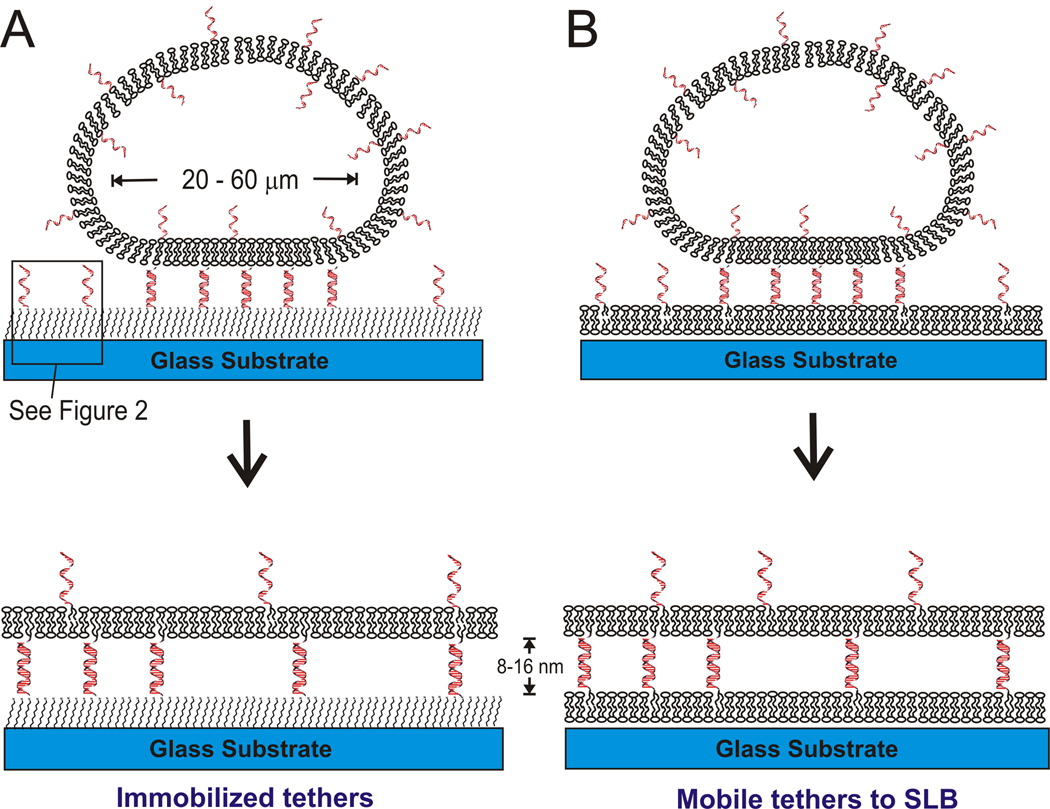
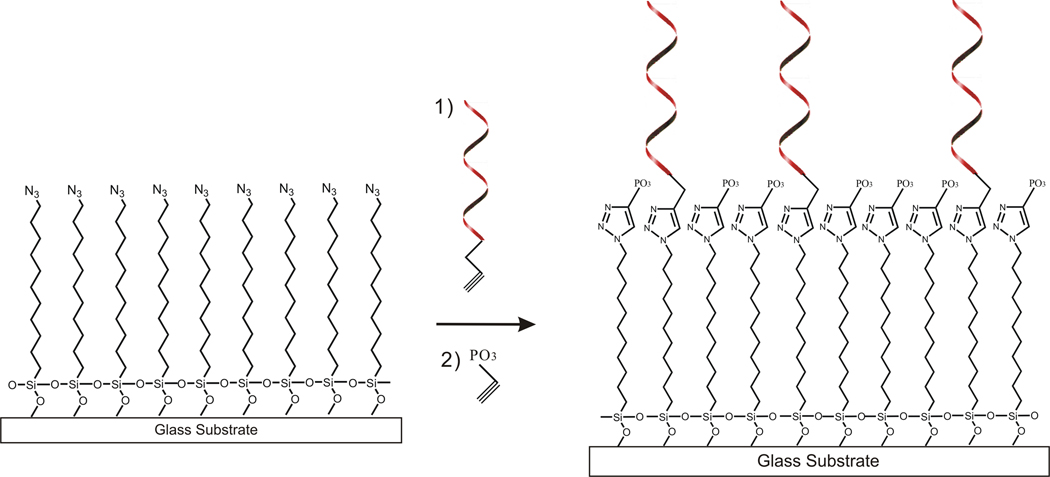
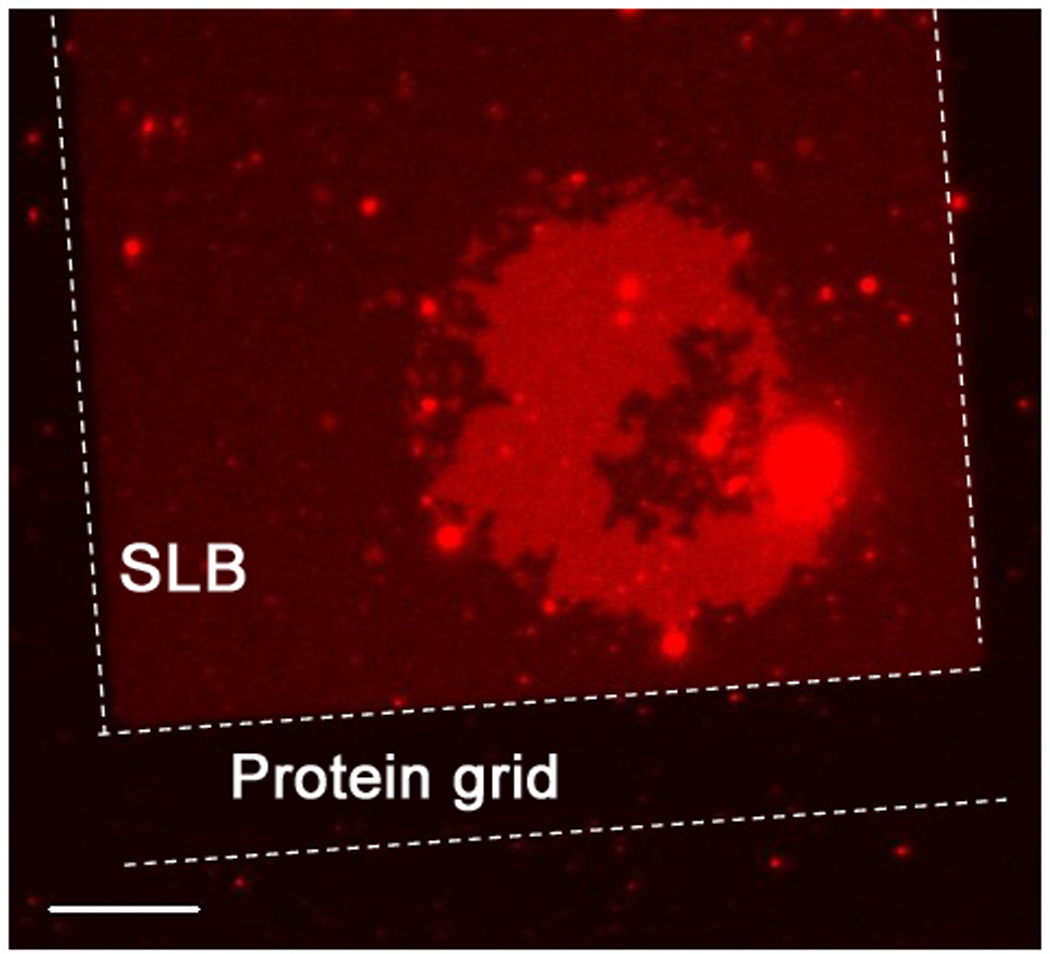
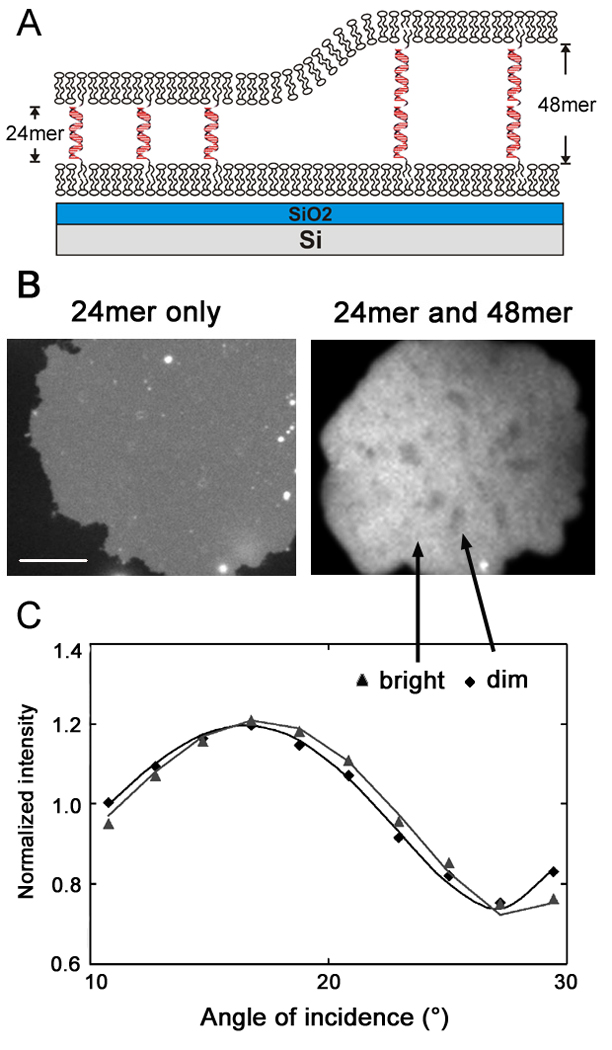
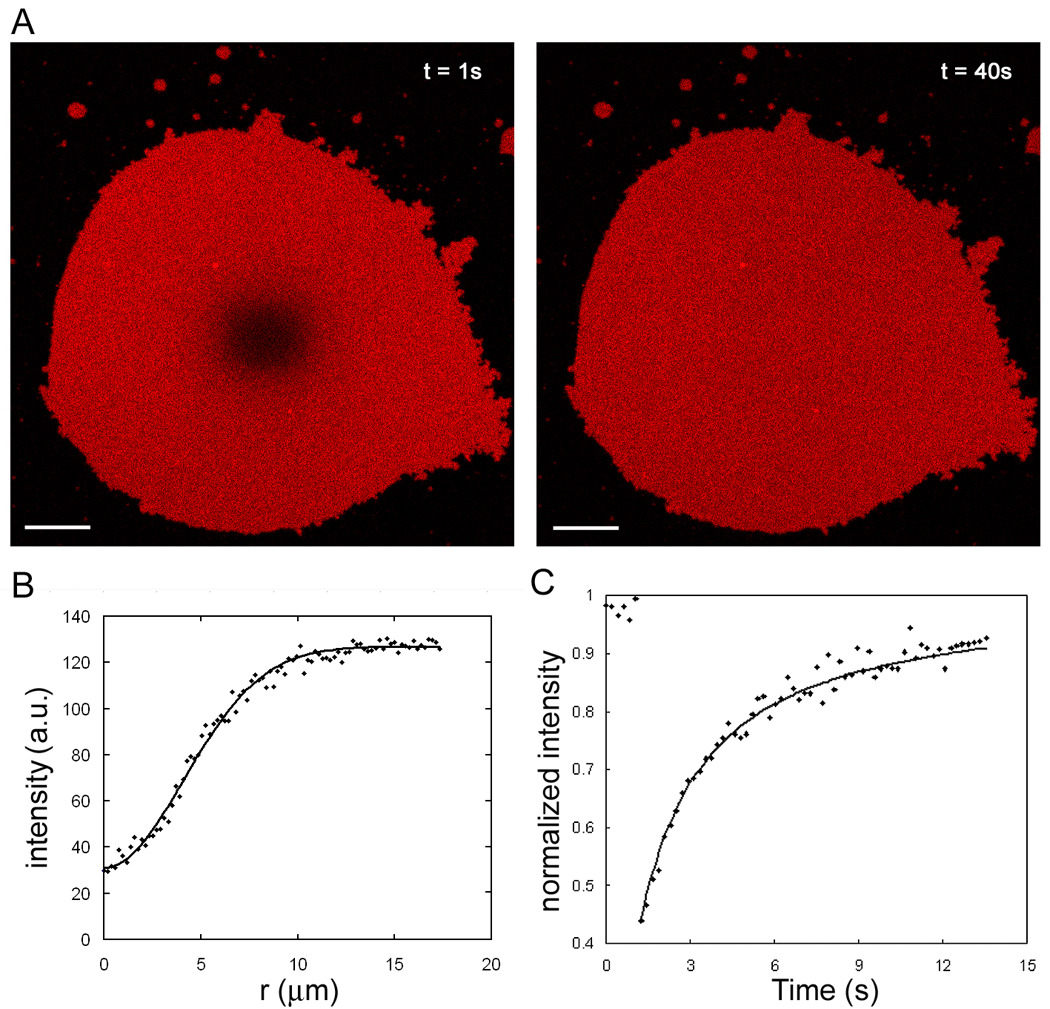
We have developed a strategy for preparing tethered lipid bilayer membrane patches on solid surfaces by DNA hybridization. In this way, the tethered membrane patch is held at a controllable distance from the surface by varying the length of the DNA used. Two basic strategies are described. In the first, single-stranded DNA strands are immobilized by click chemistry to a silica surface, whose remaining surface is passivated to prevent direct assembly of a solid supported bilayer. Then giant unilamellar vesicles (GUVs) displaying the antisense strand, using a DNA-lipid conjugate developed in earlier work [Chan, Y.-H.M., van Lengerich, B., et al., 2008. Lipid-anchored DNA mediates vesicle fusion as observed by lipid and content mixing. Biointerphases 3 (2), FA17-FA21], are allowed to tether, spread and rupture to form tethered bilayer patches. In the second, a supported lipid bilayer displaying DNA using the DNA-lipid conjugate is first assembled on the surface. Then GUVs displaying the antisense strand are allowed to tether, spread and rupture to form tethered bilayer patches. The essential difference between these methods is that the tethering hybrid DNA is immobile in the first, while it is mobile in the second. Both strategies are successful; however, with mobile DNA hybrids as tethers, the patches are unstable, while in the first strategy stable patches can be formed. In the case of mobile tethers, if different length DNA hybrids are present, lateral segregation by length occurs and can be visualized by fluorescence interference contrast microscopy making this an interesting model for interactions that occur in cell junctions. In both cases, lipid mobility is high and there is a negligible immobile fraction. Thus, these architectures offer a flexible platform for the assembly of lipid bilayers at a well-defined distance from a solid support.


Figures

Figure 1
Figure 1
schematic diagram of DNA-tethered membrane formation by GUV rupture onto (A) self-assembled alkylsilane monolayers, see Figure 2 for details; and (B) supported lipid bilayers. The GUV membrane contains DNA-linked lipids, which mediate vesicle binding and rupture. In (A), the glass substrate is functionalized with an azide-terminated alkyl-siloxane monolayer to which complementary DNAs are immobilized via the click reaction (see Figure 2). The distance from the substrate is controllable by adjusting the DNA length, about 8 nm for 24mer and 16 nm for 48mer DNA. In (B), a supported lipid bilayer presenting DNA is first formed on the glass substrate, and then exposed to GUVs presenting the complementary DNA to form a DNA-tethered membrane. In both cases, tethered membrane patches whose area is approximately that of the original GUVs are formed.
Figure 2
Figure 2
The general synthetic scheme to make the immobilized DNA surface (c.f. Fig. 1A). 5' alkyne modified DNA (Alkyne-C6-5' DNA) is clicked to the azide-modified glass surface in step 1 at approximately 1% coverage, and the remaining free azides are then clicked with ethynyl phosphonic acid in step 2.
Figure 3
Figure 3
Estimation of click-immobilized DNA density. DNA-immobilized substrates are prepared with the click reaction for 2 hr using different concentrations of alkynyl-oligonucleotides. Cy5 labeled complementary DNA was then hybridized and its fluorescence intensity, reflecting the immobilized DNA density, was measured. Fluorescence intensities are calibrated with supported lipid bilayers displaying known amounts of DNA-lipid conjugates (blue triangles and dotted line, see text). The apparent surface density of immobilized DNA incubated with labeled alkynyl-oligonucleotides concentration is then estimated (red squares).
Figure 4
Figure 4
Giant vesicle to tethered membrane patch transformation observed by fluorescence microscopy. These images are of stable tethered membranes with immobile tethers (Fig 1A); those with mobile tethers are very similar. The epifluorescence microscopy images, left side, and confocal microscopy images in the corresponding state, right side, are displayed in parallel. While F is exhibited parallel to the surface, B, D and H are 20 degree tilted to show a better view of their 3-dimensional shape. (A and B) When the GUV starts to bind via DNA hybridization, only the bottom part of vesicle is in contact with the surface and shows a ring shape. Meanwhile, the upper part of the vesicle out of the focal plane appears as a cloudy halo around the ring. (C and D) Further binding of DNA from the vesicle to the surface flattens the vesicle asymmetrically. (E and F) Eventually, the upper membrane ruptures. Afterwards, a single bilayer remains (dark area) with some transient double bilayer (bright regions). (G and H) After all of the upper bilayer spreads, a homogeneous tethered membrane is formed. While the epifluorescence microscopy images are taken from the same GUV in about 5 minutes, the confocal microscopy images take much longer to collect and are of different GUVs captured at comparable times (see text). Scale bar of epifluorescence microscopy is 15µm.
figure 5
figure 5
A fluorescently labeled tethered bilayer patch (bright red) with mobile DNA tethers on an unlabeled supported bilayer in the process of disintegrating. The supported bilayers are confined by a protein grid outlined with dotted lines, to observe the build-up of weak red fluorescence from the lipid materials that were part of the unstable tethered patch. This shows that the broken part of the tethered bilayer remains mostly on the SLB. One side of the rectangular protein grid is 100 µm and the scale bar is 15 µm.
Figure 6
Figure 6
DNA tether segregation by different lengths of DNA hybridization on a mobile SLB (c.f Fig. 1B). (A) Schematic illustration of segregation involving two lengths of DNA hybrids between the mobile membrane surfaces. The substrate is 260 nm of SiO2 of grown on atomically flat Si to allow for quantitative analysis by VIA-FLIC. (B) Fluorescence image of Texas red labeled tethered bilayer patches. When only 24-mer DNA tethers were used (left, poly A/poly T), the intensity is homogeneous across the membrane. With mixed 24-mer (poly A/poly T) and 48-mer (fully overlapping sequence) tethers, bright and dark domains were observed that indicate regions where the DNA hybrids have segregated by length. Left scale bar is 15 µm, and right image is 10 µm wide. (C) The fluorescence signal as a function of angle of incidence for selected bright and dark regions of the 24/48-mer tethered patch. The intensity counts are normalized by dividing by the mean counts recorded per image for each region, so that the shape of each curve can be more easily compared. The lines show the fits of the VIA-FLIC model to the data: for the dim region, the separation distance is fit as 10.0 nm, for the bright region, it is fit as 16.9 nm.
Figure 7
Figure 7
FRAP analysis of lipid mobility in tethered membrane patches. (A) The images show a representative example of recovery after photobleaching of 4 µm bleached spot (left) in a fluorescently labeled DNA-tethered membrane patch. This is on the immobilized DNA tethers as Figure 1A. Scale bar is 5 µm. (B) Circular averaged radial profile (dots) from the center of bleached spot is generated from the initial intensity profile after bleaching, I(r, t = 0), to reduce noise. K and w values (see Materials and Methods) from a fit to a Gaussian function (line) are used for plotting graph C. (C) Representative normalized fluorescence intensity recovery curve (dots) of bleached spot is plotted. This is fitted to obtain diffusion coefficient and mobile fraction (line). The first 6 data points are intensities before bleaching.

References

    1. Ajo-Franklin CM, Ganesan PV, et al. Variable incidence angle fluorescence interference contrast microscopy for z-imaging single objects. Biophys J. 2005;89(4):2759–2769. - PMC - PubMed
    1. Ajo-Franklin CM, Kam L, et al. High refractive index substrates for fluorescence microscopy of biological interfaces with high z contrast. Proc Natl Acad Sci U S A. 2001;98(24):13643–13648. - PMC - PubMed
    1. Ajo-Franklin CM, Yoshina-Ishii C, et al. Probing the structure of supported membranes and tethered oligonucleotides by fluorescence interference contrast microscopy. Langmuir. 2005;21(11):4976–4983. - PubMed
    1. Ali MB, Bessueille F, et al. Use of ultra-thin organic silane films for the improvement of gold adhesion to the silicon dioxide wafers for (bio)sensor applications. Materials Science and Engineering C. 2008;28:628–632.
    1. Axelrod D, Koppel DE, et al. Mobility measurement by analysis of fluorescence photobleaching recovery kinetics. Biophys J. 1976;16(9):1055–1069. - PMC - PubMed

Publication types

MeSH terms

LinkOut - more resources