. 2009;60(13):3665-76.
doi: 10.1093/jxb/erp206. Epub 2009 Jun 26.

Exploring the importance of within-canopy spatial temperature variation on transpiration predictions

Affiliations

Exploring the importance of within-canopy spatial temperature variation on transpiration predictions

William L Bauerle et al. J Exp Bot. 2009.

Abstract

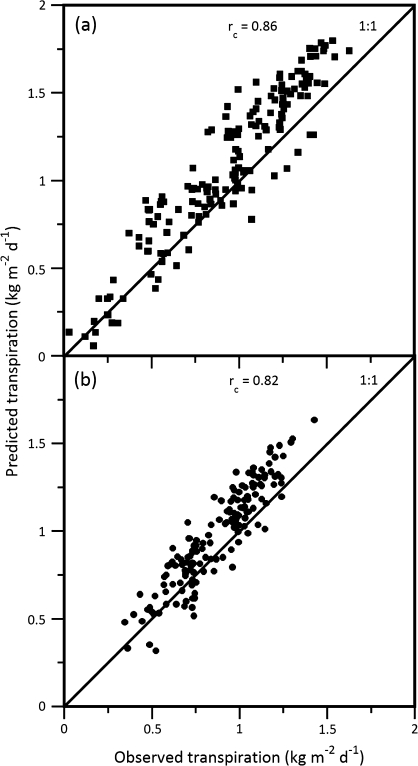
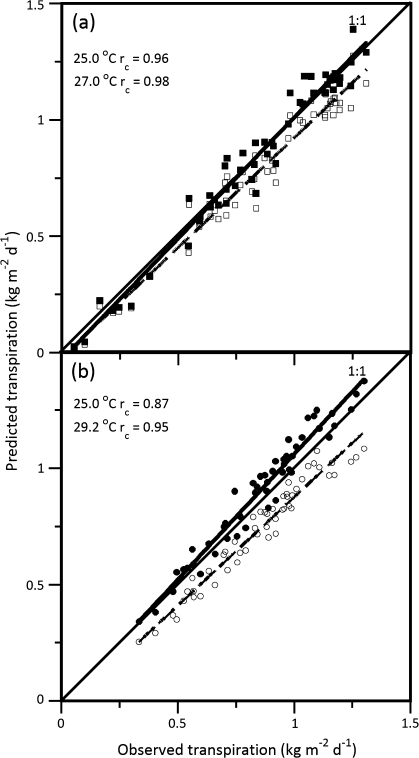
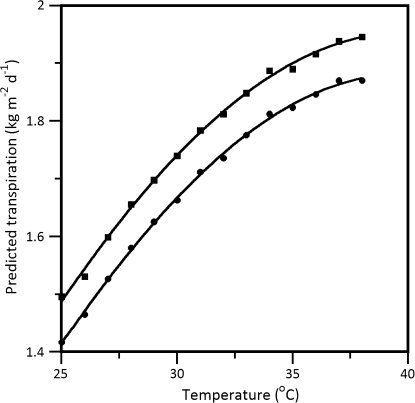
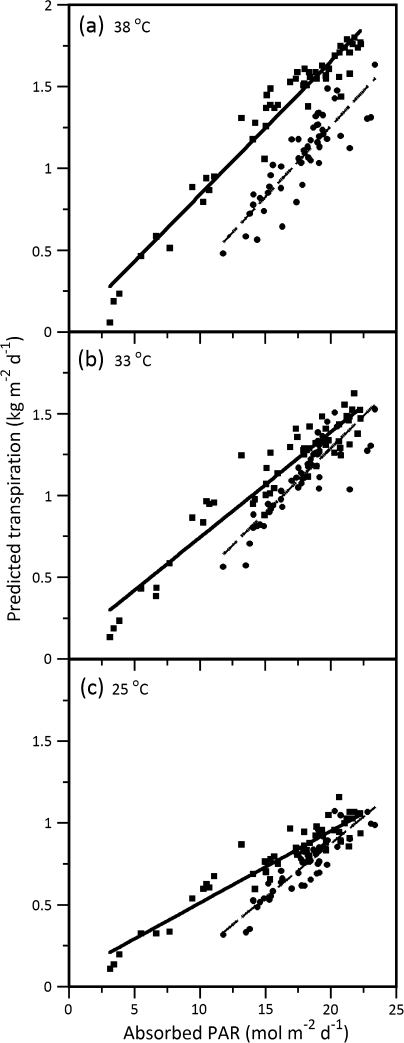
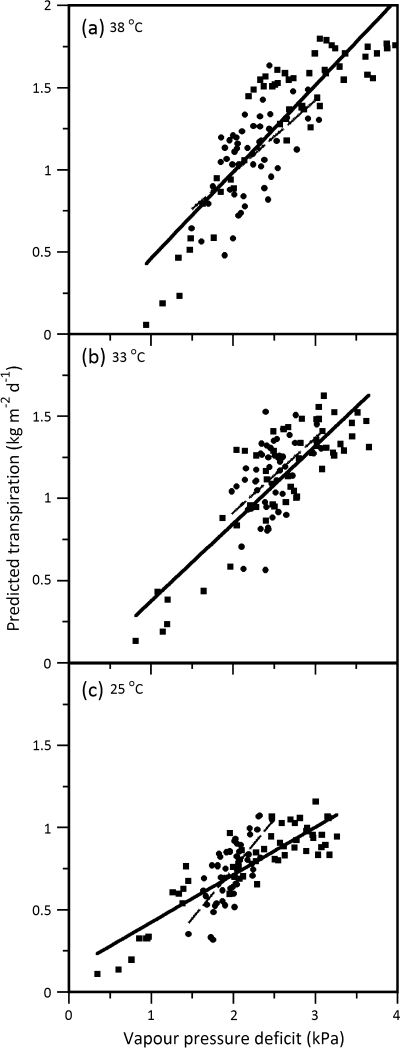
Models seldom consider the effect of leaf-level biochemical acclimation to temperature when scaling forest water use. Therefore, the dependence of transpiration on temperature acclimation was investigated at the within-crown scale in climatically contrasting genotypes of Acer rubrum L., cv. October Glory (OG) and Summer Red (SR). The effects of temperature acclimation on intracanopy gradients in transpiration over a range of realistic forest growth temperatures were also assessed by simulation. Physiological parameters were applied, with or without adjustment for temperature acclimation, to account for transpiration responses to growth temperature. Both types of parameterization were scaled up to stand transpiration (expressed per unit leaf area) with an individual tree model (MAESTRA) to assess how transpiration might be affected by spatial and temporal distributions of foliage properties. The MAESTRA model performed well, but its reproducibility was dependent on physiological parameters acclimated to daytime temperature. Concordance correlation coefficients between measured and predicted transpiration were higher (0.95 and 0.98 versus 0.87 and 0.96) when model parameters reflected acclimated growth temperature. In response to temperature increases, the southern genotype (SR) transpiration responded more than the northern (OG). Conditions of elevated long-term temperature acclimation further separate their transpiration differences. Results demonstrate the importance of accounting for leaf-level physiological adjustments that are sensitive to microclimate changes and the use of provenance-, ecotype-, and/or genotype-specific parameter sets, two components likely to improve the accuracy of site-level and ecosystem-level estimates of transpiration flux.


Figures

Fig. 1.
Fig. 1.
A side view diagram of the Mylar® crown section temperature treatment chambers. Simultaneously, each of three prescribed temperatures were controlled on four separate replicate tree crowns per genotype. The controlled temperature of each crown section is denoted to the immediate left of the section in °C (25, 33, and 38). Arrows with reference numbers denote the following: (i) separately plumbed air ducts per crown section, (ii) micro irrigation emitters, (iii) ventilation and crown access ports, and (iv) location of air conditioners. A full description of individual crown section temperature control, measurement, and model application is provided in the Materials and methods section. Please note, the transparency of the chambers is darkened compared to the actual experimental conditions for visual clarity of the crown sections.
Fig. 2.
Fig. 2.
Diurnal time series comparison of measured (solid line) versus predicted (dashed line) transpiration over five representative consecutive days in 2003 for each Acer rubrum genotype from thermally contrasting parentage, cv. Summer Red (A–C) and cv. October Glory (D–F) at a growth temperature of (A) 38 oC, (B) 33 oC, (C) 25 oC, (D) 38 oC, (E) 33 oC, and (F) 25 oC.
Fig. 3.
Fig. 3.
Reproducibility of analyses of daily mean transpiration comparing Acer rubrum L. genotypes (a) Summer Red, closed squares and (b) October Glory, closed circles over three controlled daytime growth temperature conditions (25, 33, or 38 oC). Measured versus predicted transpiration concordance correlation coefficients (rc) are reported in each panel along with a 45° 1:1 line through the origin that represents perfect reproducibility. Each symbol represents the mean daily transpiration of four replicate trees in which tree crown sections were controlled at 25, 33, or 38 °C over a 50 d time period.
Fig. 4.
Fig. 4.
Reproducibility of analyses of daily transpiration comparing Acer rubrum L. genotypes (a) Summer Red (squares) and (b) October Glory (circles) under two temperature acclimation conditions: (i) average daytime ambient over the first 50 d (Summer Red, 27 oC and October Glory, 29.2 oC), closed symbols and (ii) acclimation to 25 oC, open symbols. Measured versus predicted transpiration concordance correlation coefficients (rc) are reported in each panel along with a 45° 1:1 line through the origin that represents perfect reproducibility. Each symbol represents the mean daily transpiration of 12 tree crown sections within four replicate trees over a 50 d time period.
Fig. 5.
Fig. 5.
Impact of physiological variation on predicted daily transpiration between Summer Red (closed squares) and October Glory (closed circles) genotypes response to temperature. Model simulations were run with each genotypes respective physiology on Julian day 182 (1 July) at an absorbed PAR of 25 mol m−2 d−1, a model controlled vapour pressure deficit of 1.25 kPa, and a wind speed of 0 m s−1. All other parameter values are listed in Table 1.
Fig. 6.
Fig. 6.
Predicted daily transpiration versus absorbed photosynthetically active radiation (Absorbed PAR) in relation to growth temperature acclimation at (a) 38 °C, (b) 33 °C, and (c) 25 °C. The Summer Red estimates (closed squares; solid line) versus the October Glory estimates (closed circles; dashed line) are illustrated in each panel.
Fig. 7.
Fig. 7.
Predicted daily transpiration versus chamber vapour pressure deficit in relation to growth temperature acclimation at (a) 38 °C, (b) 33 °C, and (c) 25 °C. The Summer Red estimates (closed squares; solid line) versus the October Glory estimates (closed circles; dashed line) are illustrated in each panel.

References

    1. Ball JT, Woodrow IE, Berry JA. A model predicting stomatal conductance and its contribution to the control of photosynthesis under different environmental conditions. In: Biggins J, editor. Progress in photosynthesis research. Dordrecht, The Netherlands: Martinus Nijhoff Publishers; 1987. pp. 221–224.
    1. Baldocchi DD, Harley PC. Scaling carbon dioxide and water vapour exchange from leaf to canopy in a deciduous forest. II. Model testing and applications. Plant, Cell and Environment. 1995;18:1331–1340.
    1. Baldocchi DD, Wilson KB, Gu L. How the environment, canopy structure and canopy physiological functioning influence carbon, water and energy fluxes of a temperate broad-leaved deciduous forest: an assessment with the biophysical model CANOAK. Tree Physiology. 2002;22:1065–1077. - PubMed
    1. Bauerle WL, Bowden JD, Wang GG. The influence of temperature on within-canopy acclimation and variation in leaf photosynthesis and respiration: spatial acclimation to microclimate gradients among thermally divergent Acer rubrum L. genotypes. Journal of Experimental Botany. 2007;58:3285–3298. - PubMed
    1. Bauerle WL, Bowden JD, McLeod MF, Toler JE. Modeling intra-crown and intra-canopy interactions in red maple: assessment of light transfer on carbon dioxide and water vapor exchange. Tree Physiology. 2004;24:589–597. - PubMed

Publication types