. 2009 Sep;76(3):667-78.
doi: 10.1124/mol.109.055830. Epub 2009 Jun 26.

Dual mechanisms of sHA 14-1 in inducing cell death through endoplasmic reticulum and mitochondria

Affiliations

Dual mechanisms of sHA 14-1 in inducing cell death through endoplasmic reticulum and mitochondria

David Hermanson et al. Mol Pharmacol. 2009 Sep.

Abstract

HA 14-1 is a small-molecule Bcl-2 antagonist that promotes apoptosis in malignant cells, but its mechanism of action is not well defined. We recently reported that HA 14-1 has a half-life of only 15 min in vitro, which led us to develop a stable analog of HA 14-1 (sHA 14-1). The current study characterizes its mode of action. Because of the antiapoptotic function of Bcl-2 family proteins on the endoplasmic reticulum (ER) and mitochondria, the effect of sHA 14-1 on both organelles was evaluated. sHA 14-1 induced ER calcium release in human leukemic cells within 1 min, followed by induction of the ER stress-inducible transcription factor ATF4. Similar kinetics and stronger intensity of ER calcium release were induced by the sarcoendoplasmic reticulum Ca(2+)-ATPase (SERCA) inhibitor thapsigargin, accompanied by similar kinetics and intensity of ATF4 induction. sHA 14-1 directly inhibited SERCA enzymatic activity but had no effect on the inositol triphosphate receptor. Evaluation of the mitochondrial pathway showed that sHA 14-1 triggered a loss of mitochondrial transmembrane potential (Delta psi m) and weak caspase-9 activation, whereas thapsigargin had no effect. (R)-4-(3-Dimethylamino-1-phenylsulfanylmethyl-propylamino)-N-{4-[4-(4'-chloro-biphenyl-2-ylmethyl)-piperazin-1-yl]-benzoyl}-3-nitrobenzenesulfonamide (ABT-737), a well established small-molecule Bcl-2 antagonist, rapidly induced loss of Delta psi m and caspase-9 activation but had no effect on the ER. The pan-caspase inhibitor N-benzyloxycarbonyl-Val-Ala-Asp-fluoromethyl ketone had some protective effect on sHA 14-1-induced cell death. These collective results suggest a unique dual targeting mechanism of sHA 14-1 on the apoptotic resistance machinery of tumor cells that includes antiapoptotic Bcl-2 family proteins and SERCA proteins.


Figures

Fig. 1.
Fig. 1.
Structure of the compounds used in the present study and IC50 data for sHA 14-1. A, chemical structures of sHA 14-1, isHA 14-1, ABT-737, thapsigargin, and HA 14-1. As described under Materials and Methods, isHA 14-1 is an inactive variant of sHA 14-1. B, RS4;11, BLIN-1, and NALM-6 were incubated with various concentrations of sHA 14-1 for 18 h, and Annexin V-/PI- viable cells were quantified by flow cytometry. Each condition represents the mean ± S.D. of triplicate values. The results are representative of multiple experiments.
Fig. 2.
Fig. 2.
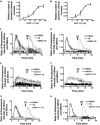
sHA 14-1 induces ER calcium release. NALM-6 (A, C, E, and G) and JURKAT (B, D, F, and H) were preloaded with Fura-2AM for 30 min. The cells were then washed, and fluorescent changes at excitation wavelengths of 340 and 380 nm were monitored on a dual-wavelength fluorometer. Data in A and B show the relative extent of cytosolic [Ca2+] changes after a 10-min incubation with the indicated concentrations of sHA 14-1 (normalized to the maximum cytosolic [Ca2+] increase induced by sHA 14-1 treatment). Data are mean ± S.D. (n = 3 for each conditions). Data in C to H show real-time changes in cytosolic [Ca2+] in cells treated with DMSO, 1 μM thapsigargin, 100 μM sHA 14-1, or 100 μM isHA 14-1. The gray tracings indicate that thapsigargin was added 10 min after the initial addition of DMSO (C and D), sHA 14-1 (E and F), or isHA 14-1 (G and H). The results are representative of three separate experiments.
Fig. 3.
Fig. 3.
Cytosolic [Ca2+] is an essential factor for sHA 14-1-induced cytotoxicity and sHA 14-1 directly targets the ER. A, untreated NALM-6 cells (black solid bar) or cells pretreated for 30 min with 5 μM EGTA-AM (gray bar) were incubated with the indicated concentrations of sHA 14-1. Relative cell viability was determined at 24 h by the Cell Titer-Blue cytotoxicity assay. Data are mean ± S.D. (n = 3 for each condition). Results are representative of three separate experiments. **, p < 0.01; ***, p < 0.0001. B, time course of Ca2+ uptake into intracellular Ca2+ stores in control cells (▪) and cells pretreated (5 min) with sHA 14-1 (50 μM,▴). Data are expressed relative to the final time point intracellular Ca2+ content. C and D, Ca2+ release from permeabilized NALM-6 cells loaded to steady state with 45Ca2+ induced by various concentrations of sHA 14-1 (C) or IP3 (D). Data are expressed relative to the zero time point before addition of ATP. Data are mean ± S.D. (n = 3 for each conditions). The results are representative of two separate experiments.
Fig. 4.
Fig. 4.
sHA 14-1 does not disrupt the function of the endoplasmic reticulum IP3R. A, parental (black bar) and IP3R-deficient (gray bar) DT-40 chicken lymphoma cells were incubated with the indicated concentrations of sHA 14-1, and relative cell viability was determined after 24 h by the Cell TiterBlue cytotoxicity assay. B, parental (black column) and IP3R-deficient (gray column) DT-40 chicken lymphoma cells were preloaded with Fura-2AM and treated with sHA 14-1 at indicated concentrations. Relative calcium release was measured using fluorescent changes at excitation wavelengths of 340 and 380 nm monitored on a dual-wavelength fluorometer and normalized to the amount of calcium release by thapsigarin in parental cells at the concentration of 1 μM. Data are mean ± S.D. (n = 3 for each conditions). None of the difference in calcium release in parental and IP3R-deficient cells is statistically significant (P > 0.05). The results are representative of three separate experiments.
Fig. 5.
Fig. 5.
sHA 14-1 inhibits SERCA enzymatic activity. NALM-6 (A) and JURKAT (B) cells were preloaded with Fura-2AM for 30 min. The cells were then incubated with 100 nM thapsigargin (+), the minimal concentration to induce full Ca2+ release, and increasing concentrations of sHA 14-1, as shown in the grid below the figures. Calcium release was quantified using fluorescent changes at excitation wavelengths of 340 and 380 nm monitored on a dual-wavelength fluorometer. Data are mean ± S.D. (n = 3 for each conditions). *, p < 0.05; **, p < 0.01; ***, p < 0.0001 compared with the quantity of calcium released by TG alone. C, increasing concentrations of sHA 14-1 were incubated for 10 min at 37°C with SR membrane fractions purified from rabbit skeletal muscle. Rabbit skeletal muscle Ca2+ ATPase activity (corresponding to SERCA 1A) was measured using the phosphate liberation assay, as described previously (Wootton and Michelangeli, 2006). Data are mean ± S.D. (n = 3 for each conditions). D, increasing concentrations of sHA 14-1 were incubated for 10 min at 37°C with pig brain microsomes. Ca2+ ATPase activity in these membranes (corresponding to SERCA 2B) was measured using a phosphate liberation assay, as described previously. Data are mean ± S.D. (n = 3 for each conditions). E, a SERCA sample (99%, 20 μg) was analyzed for the presence of Bcl-2 protein by Western blot with NALM-6 protein lysate (0.2, 1, and 5 μg) as a positive control. The results are representative of three separate experiments.
Fig. 6.
Fig. 6.
sHA 14-1 induces ER stress. NALM-6 cells were incubated with 1 μM TG or 50 μM sHA 14-1 for the indicated times (A) or with 1 μM thapsigargin and the indicated concentrations of sHA 14-1 for 2 h (B). RS4;11 cells were incubated with the indicated compounds and concentrations for 2 h (C). DMSO (2 h) was used as a negative control. The cells were then lysed and Western-blotted for detection of ATF4 and cleaved caspase-9 (Casp-9) as described under Materials and Methods. β-Tubulin (A and B), or AKT (C) were used as loading controls. The results are representative of three separate experiments.
Fig. 7.
Fig. 7.
sHA 14-1 induces loss of Δψm but no detectable cytochrome c release by flow cytometry. A, NALM-6 cells were incubated with sHA 14-1 or isHA 14-1 at 50 μM (dashed line) or 100 μM (solid line) or ABT-737 at 5 μM (dashed line) or 10 μM (solid line) for 8 h. B, RS4;11 cells were incubated for 8 h with 50 μM (dashed line) or 100 μM (solid line) sHA 14-1 or for 2 h with 0.3 μM (dashed line) or 1 μM (solid line) ABT-737. C, NALM-6 and RS4;11 cells were incubated with 0.1 μM (dashed line) or 1 μM (solid line) thapsigargin for 6 or 24 h. Cells were stained with TMRE or anti-cytochrome c and analyzed by flow cytometry. The gray-shaded histograms show TMRE staining intensity or cytochrome c detection in untreated cells. Results are representative of three separate experiments.
Fig. 8.
Fig. 8.
sHA 14-1-induced cell death is largely caspase-independent. RS4;11 cells were incubated with DMSO, 50 μM Z-VAD-fmk alone, 100 μM isHA 14-1, 1 μM TG, 100 μM sHA 14-1, 100 μM sHA 14-1 + 50 μM Z-VAD-fmk, 100 nM ABT-737, or 100 nM ABT-737 + 50 μM Z-VAD-fmk. After 18 h, cells were stained with PI and Annexin V. The data are shown as the light-scatter characteristics on the left side of each condition tested and the PI/Annexin V (ANV) staining as contour plots on the right side of each condition tested. PI/Annexin V analysis was conducted on the cells outlined by the solid line in the light scatter dot plots. The events within the dashed circles in the sHA 14-1- and ABT-737-treated cells are shown to distinguish the difference in light scatter characteristics between the two treated populations. FSC, forward scatter; SSC, side scatter.

References

    1. Adams JM and Cory S (2007) The Bcl-2 apoptotic switch in cancer development and therapy. Oncogene 26 1324-1337. - PMC - PubMed
    1. An J, Chen Y, and Huang Z (2004) Critical upstream signals of cytochrome c release induced by a novel Bcl-2 inhibitor. J Biol Chem 279 19133-19140. - PubMed
    1. An J, Chervin AS, Nie A, Ducoff HS, and Huang Z (2007) Overcoming the radioresistance of prostate cancer cells with a novel Bcl-2 inhibitor. Oncogene 26 652-661. - PubMed
    1. Bilmen JG and Michelangeli F (2002) Inhibition of the type 1 inositol 1,4,5-trisphosphate receptor by 2-aminoethoxydiphenylborate. Cell Signal 14 955-960. - PubMed
    1. Birmachu W, Nisswandt FL, and Thomas DD (1989) Conformational transitions in the calcium adenosinetriphosphatase studied by time-resolved fluorescence resonance energy transfer. Biochemistry 28 3940-3947. - PubMed

Publication types

MeSH terms

Substances