. 2009 Sep;37(17):e115.
doi: 10.1093/nar/gkp542. Epub 2009 Jun 26.

Conserved principles of mammalian transcriptional regulation revealed by RNA half-life

Affiliations

Conserved principles of mammalian transcriptional regulation revealed by RNA half-life

Caroline C Friedel et al. Nucleic Acids Res. 2009 Sep.

Abstract

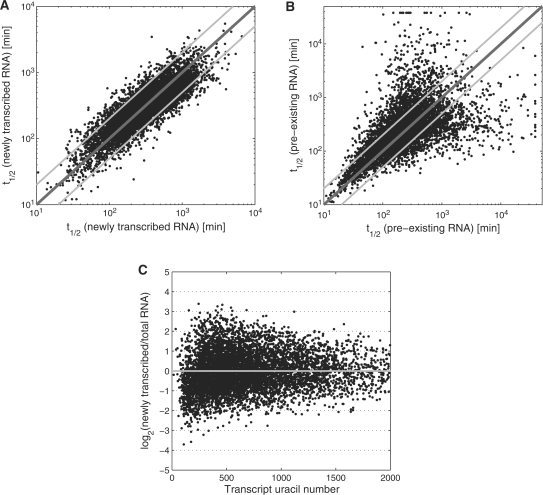
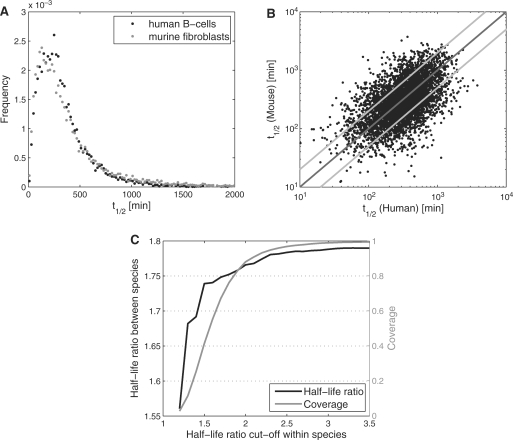
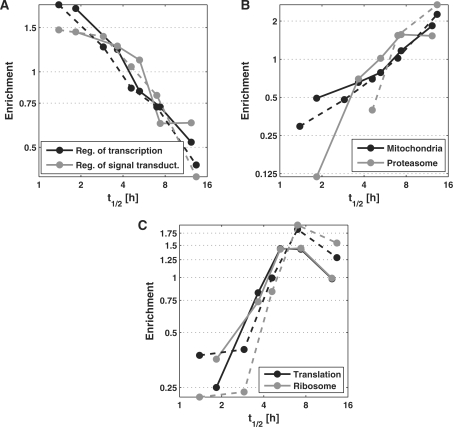
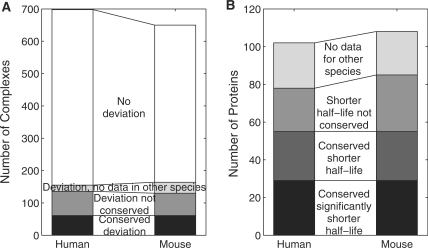
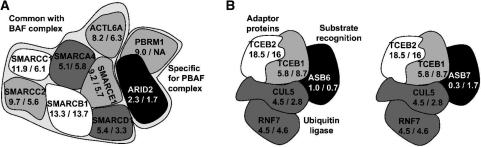
RNA levels in a cell are regulated by the relative rates of RNA synthesis and decay. We recently developed a new approach for measuring both RNA synthesis and decay in a single experimental setting by biosynthetic labeling of newly transcribed RNA. Here, we show that this provides measurements of RNA half-lives from microarray data with a so far unreached accuracy. Based on such measurements of RNA half-lives for human B-cells and mouse fibroblasts, we identified conserved regulatory principles for a large number of biological processes. We show that different regulatory patterns between functionally similar proteins are characterized by differences in the half-life of the corresponding transcripts and can be identified by measuring RNA half-life. We identify more than 100 protein families which show such differential regulatory patterns in both species. Additionally, we provide strong evidence that the activity of protein complexes consisting of subunits with overall long transcript half-lives can be regulated by transcriptional regulation of individual key subunits with short-lived transcripts. Based on this observation, we predict more than 100 key regulatory subunits for human complexes of which 28% could be confirmed in mice (P < 10(-9)). Therefore, this atlas of transcript half-lives provides new fundamental insights into many cellular processes.


Figures

Figure 1.
Figure 1.
Comparison of RNA half-lives determined in human B-cells based on newly transcribed/total RNA ratios (A) and pre-existing/total RNA ratios (B) following 1 h of 4sU labeling. RNA half-lives were determined independently for two replicates. The x-axis shows the half-life of each gene for the first replicate and the y-axis the corresponding half-life for the second replicate. Dark grey diagonals indicate equal RNA half-lives and light grey lines a deviation by a factor of 2. (C) Comparison of transcript uracil number (number of uracils in spliced transcript) against the logarithm of newly transcribed/total RNA ratios for human B-cells (correlation coefficient = −0.014). Here, expression levels before the second normalization step were used. The grey line indicates no correlation, i.e. no transcript length bias.
Figure 2.
Figure 2.
(A) Distribution of transcript half-lives for human B-cells and murine fibroblasts. (B) Comparison of half-lives between human B-cells and murine fibroblasts for about 5000 genes based on orthology assignments from the MGD database (27). (C) Average half-life ratios between species were calculated only for genes for which half-life ratios among different replicates for the same species were below a specific cut-off (x-axis). For each cut-off, average half-life ratios between species (black) and coverage (grey), i.e. fraction of genes selected by the cut-off, are shown. Half-life ratios decreased significantly when more selective cut-offs were chosen.
Figure 3.
Figure 3.
To illustrate the correlation between gene function and transcript half-life, we determined the enrichment of specific functional category (y-axis) within different intervals of transcript half-life (x-axis) for human B-cells (solid lines) and mouse fibroblasts (dashed lines). For this purpose, the range of transcript half-lives in human B-cells and mouse fibroblasts, respectively, was divided into five intervals each containing approximately the same number of genes. Enrichment for a specific functional category in each interval was then calculated as the ratio of the frequency for this functional category within this interval divided by the overall frequency for this category. Results are shown for (A) transcripts involved in regulation of transcription (black) and signal transduction (grey), (B) mitochondrial (black) and proteasomal transcripts (grey) and (C) translational (black) and ribosomal (grey) transcripts.
Figure 4.
Figure 4.
(A) Number of complexes containing at least one subunit with (i) significantly shorter transcript half-life than the median RNA half-life in the complex and (ii) no similarity in transcript half-life to any other complex it is contained in (black, grey and light grey) and number of complexes containing no such subunits (white). In the first case, we distinguished between complexes for which the deviation was conserved between species (black), for which it was not conserved (grey) or for which there were no data available in the other species (light grey). Only protein complexes were considered containing at least three subunits for which RNA half-lives could be determined in the respective species. (B) Number of proteins with significantly shorter transcript half-life than the remaining subunits in all protein complexes they are contained in. We distinguished between cases in which the significant shorter half-life was conserved (black), a shorter RNA half-life than the median RNA half-life for the complex was observed in the other species although this difference was not sufficiently pronounced (dark grey), the shorter half-life was not conserved (grey) and no data were available for the other species (light grey).
Figure 5.
Figure 5.
RNA half-lives for the PBAF (A) and ubiquitin ligase (B) complexes. Half-lives (in hours) for human/mouse are indicated and mapped to grey scales ranging from black (short RNA half-lives) to white (long RNA half-lives). For PBRM1, no transcript half-life could be obtained for murine fibroblasts. For SMARCD1, its RNA half-life in murine fibroblasts was taken from 30 min labeling experiments (14). (A) The PBAF complex consists of several proteins in common with the BAF complex and two specific proteins (ARID2 and PBRM1) (45). ARID2, the only subunit with short transcript half-life in this complex, has been found to be essential for complex stability, potentially by recruiting PBRM1 (45). As most physical interactions in the complex are not characterized, the arrangement of the proteins in this figure does not necessarily represent the true complex structure. (B) Substrate-specificity of the ubiquitin ligase containing CUL5 and RNF7 is determined by binding to different ASB proteins (46,47). TCEB1 and TCEB2 are adaptor proteins which form a heterodimeric complex (Elongin BC) and additionally link the ligase subunits (CUL5 and RNF7) and the ASB protein. Short transcript half-life of the ASB6 and ASB7 subunits allows efficient regulation of complex activity with regard to specific substrates.

References

    1. Ross J. mRNA stability in mammalian cells. Microbiol. Rev. 1995;59:423–450. - PMC - PubMed
    1. Andersson AF, Lundgren M, Eriksson S, Rosenlund M, Bernander R, Nilsson P. Global analysis of mRNA stability in the archaeon Sulfolobus. Genome Biol. 2006;7:R99. - PMC - PubMed
    1. Bernstein JA, Khodursky AB, Lin PH, Lin-Chao S, Cohen SN. Global analysis of mRNA decay and abundance in Escherichia coli at single-gene resolution using two-color fluorescent DNA microarrays. Proc. Natl Acad. Sci. USA. 2002;99:9697–9702. - PMC - PubMed
    1. Gutierrez RA, Ewing RM, Cherry JM, Green PJ. Identification of unstable transcripts in Arabidopsis by cDNA microarray analysis: rapid decay is associated with a group of touch- and specific clock-controlled genes. Proc. Natl Acad. Sci. USA. 2002;99:11513–11518. - PMC - PubMed
    1. Narsai R, Howell KA, Millar AH, O'Toole N, Small I, Whelan J. Genome-wide analysis of mRNA decay rates and their determinants in Arabidopsis thaliana. Plant Cell. 2007;19:3418–3436. - PMC - PubMed

Publication types