Comparative Study
. 2009 Aug;16(4):195-211.
doi: 10.1093/dnares/dsp011. Epub 2009 Jun 27.

Comparative methylation of ERVWE1/syncytin-1 and other human endogenous retrovirus LTRs in placenta tissues

Affiliations
Comparative Study

Comparative methylation of ERVWE1/syncytin-1 and other human endogenous retrovirus LTRs in placenta tissues

Juliette Gimenez et al. DNA Res. 2009 Aug.

Abstract

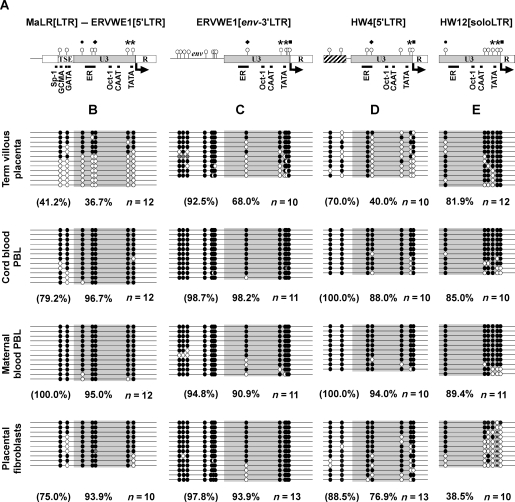
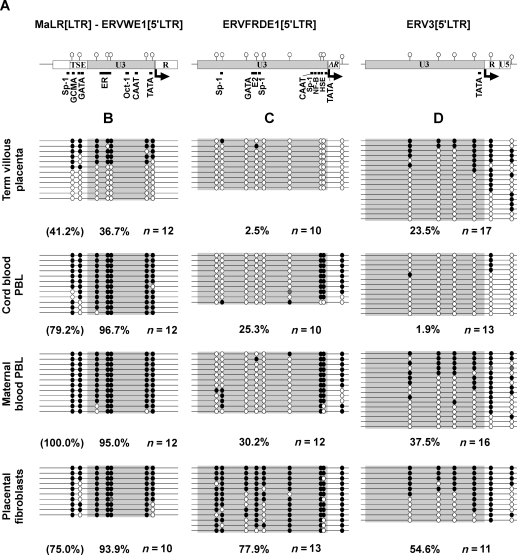
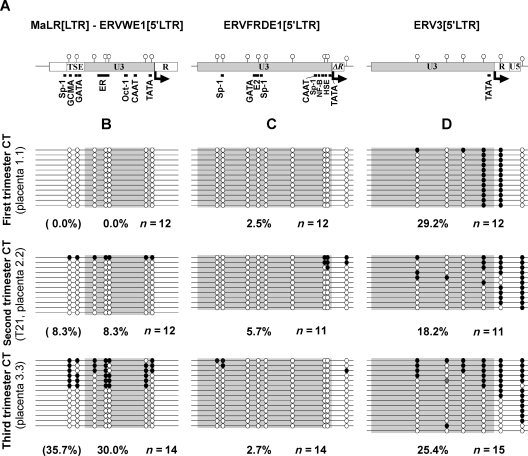
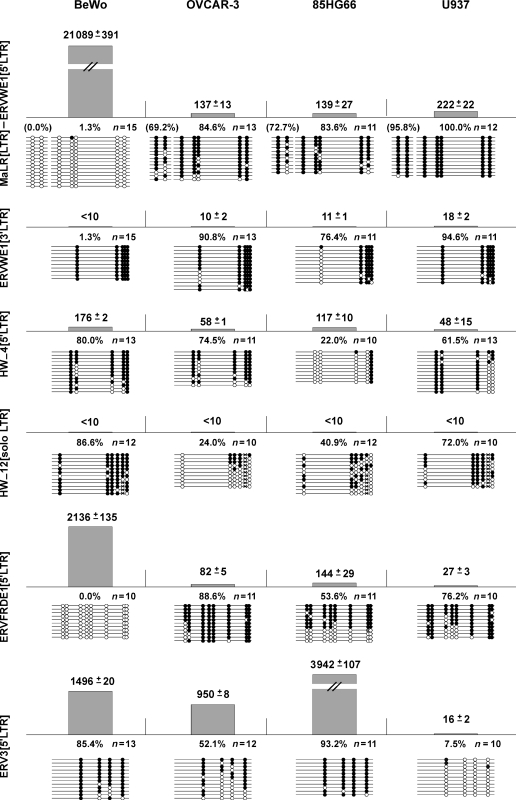
Human endogenous retroviruses (HERVs) are globally silent in somatic cells. However, some HERVs display high transcription in physiological conditions. In particular, ERVWE1, ERVFRDE1 and ERV3, three proviruses of distinct families, are highly transcribed in placenta and produce envelope proteins associated with placenta development. As silencing of repeated elements is thought to occur mainly by DNA methylation, we compared the methylation of ERVWE1 and related HERVs to appreciate whether HERV methylation relies upon the family, the integration site, the tissue, the long terminal repeat (LTR) function or the associated gene function. CpG methylation of HERV-W LTRs in placenta-associated tissues was heterogeneous but a joint epigenetic control was found for ERVWE1 5'LTR and its juxtaposed enhancer, a mammalian apparent LTR retrotransposon. Additionally, ERVWE1, ERVFRDE1 and ERV3 5'LTRs were all essentially hypomethylated in cytotrophoblasts during pregnancy, but showed distinct and stage-dependent methylation profiles. In non-cytotrophoblastic cells, they also exhibited different methylation profiles, compatible with their respective transcriptional activities. Comparative analyses of transcriptional activity and LTR methylation in cell lines further sustained a role for methylation in the control of functional LTRs. These results suggest that HERV methylation might not be family related but copy-specific, and related to the LTR function and the tissue. In particular, ERVWE1 and ERV3 could be developmentally epigenetically regulated HERVs.


Figures

Figure 1
Figure 1
Alignment of HERV-W LTR U3 promoter. ERVWE1[5′LTR] and ERVWE1[3′LTR] U3 region allelic forms were previously determined on DNA amplified from 24 individuals (e.g. -132A. individual 132, allele A), i.e. 48 sequences. HW_12[solo LTR] and HW_4[5′LTR] allelic forms derive from the annotated genome sequence (-A, reference allele; -B, alternative allele; SNP ID, rs6489086). Proportion of each allelic form is given in hooks (e.g. [3], 3 of the 48 sequences hold this allelic form; [nd], not determined). CAAT box, TATA box and transcription binding sites are indicated. Effective transcription factor binding sites are underlined; putative transcription factor binding sites are marked by interrupted lines. CpG sites are indicated by gray background, their position in the U3 region is given relative to ERVWE1 5′LTR sequence.
Figure 2
Figure 2
CpG methylation of HERV-W LTRs in placenta-associated tissues. (A) Schematic representation of MaLR[LTR]–ERVWE1[5′LTR], ERVWE1[env-3′LTR], HW_4[5′LTR] and HW_12[solo LTR] analyzed regions. LTR regions are represented by boxes and CpG dinucleotides by circles on vertical bars. The U3 region (light gray) constitutes the retroviral promoter, transcription starts at the U3/R boundary (arrow). For each LTR, CAAT and TATA boxes as well as putative and effective transcription factor binding sites proximal to or containing CpG are indicated. Symbols above CpGs point out conserved CpGs between the different LTRs, asterisk indicates CpGs conserved in all three LTRs. TSE, trophoblast-specific enhancer of ERVWE1 provirus, located in the 5′part of the MaLR LTR (white box at the 5′ end); env, env-3′UTR region of ERVWE1 provirus. The MER114 LTR located upstream from HW_4[5′LTR] is also represented (hatched box). (BE) CpG methylation of (B) MaLR[LTR]–ERVWE1[5′LTR], (C) ERVWE1[env-3′LTR], (D) HW_4[5′LTR] and (E) HW_12[solo LTR]. Methylation was determined by bisulfite sequencing PCR in villous trophoblast of term placenta, related fetal and maternal blood cells and in placental fibroblasts from chorionic villi of a first trimester placenta. Each sample result originates from the same conversion reaction. Each line represents an independent clone as determined by methylation and/or conversion differences. Methylated CpG are schematized by black circles, unmethylated CpGs by white circles, the mutated CpG (SNP) in HW_12 is represented by a cross and CpGs with undetermined methylation state by gray circles. Global methylation percentages in the U3 regions (highlighted in gray) as well as in the upstream regions (MaLR LTR, env, MER114 LTR) are given below the respective area for each sample (in parentheses for non-U3 regions).
Figure 3
Figure 3
CpG methylation envelope-coding HERV 5′LTRs in placenta-associated tissues. (A) Schematic representation of MaLR[LTR]–ERVWE1[5′LTR] (as in Fig. 2A), ERVFRDE1[5′LTR] and ERV3[5′LTR] analyzed regions. LTR regions are represented by boxes and CpG dinucleotides by circles on vertical bars. The U3 region (light gray) constitutes the retroviral promoter, transcription starts at the U3/R boundary (arrow). Putative transcription factor binding sites proximal to or overlapping CpGs are indicated. Downstream horizontal bars are provirus internal sequence. (BE) CpG methylation of (B) MaLR[LTR]–ERVWE1[5′LTR] (as in Fig. 1), (C) ERVFRDE1[5′LTR] and (D) ERV3[5′LTR]. Methylation was determined by bisulfite sequencing PCR in villous trophoblast of term placenta, related fetal and maternal blood cells and in placental fibroblasts from chorionic villi of a first trimester placenta. Each sample result originates from the same conversion reaction. Each line represents an independent clone as determined by methylation and/or conversion differences. Methylated CpG are schematized by black circles, unmethylated CpGs by white circles and CpGs with undetermined methylation state by gray circles. Global methylation percentage values in the U3 regions (highlighted in gray) as well as in the MaLR[LTR] (in parentheses) are given below the respective area for each sample.
Figure 4
Figure 4
CpG methylation dynamics of envelope-coding HERV 5′LTRs in cytotrophoblasts during pregnancy. (A) Schematic representation of the MaLR[LTR]–ERVWE1[5′LTR], ERVFRDE1[5′LTR] and ERV3[5′LTR] analyzed regions. (BD) CpG methylation of (B) MaLR[LTR]–ERVWE1[5′LTR], (C) ERVFRDE1[5′LTR] and (D) ERV3[5′LTR]. Methylation was determined by bisulfite sequencing PCR in cytotrophoblasts (CT) at different times of gestation. One sample is represented here for each trimester i.e. CT of first trimester placenta from legally induced abortion (placenta 1.1), second trimester placenta from trisomy 21-affected pregnancy (T21, placenta 2.2) and term placenta from healthy mother (placenta 3.3). Each sample result originates from the same conversion reaction. Each line represents an independent molecule. Methylated CpGs are schematized by black circles and unmethylated CpGs by white circles.
Figure 5
Figure 5
LTR promoter methylation and derived transcriptional activity. LTR-derived transcriptional activity in cell lines is represented by histograms, and the associated methylation profiles of the U3 promoter region of the LTRs are represented underneath. Real-time qPCR values were normalized by the geometric mean of HPRT and 18S housekeeping genes average and are expressed in copy number/1000 cells or 12.5 ng total RNA (numbers on the top of each bar). The associated methylation profiles were determined by bisulfite sequencing PCR. Each sample result originates from the same conversion reaction by bisulfite. Each line represents an independent molecule. Methylated CpGs are schematized by black circles and unmethylated CpGs by white circles. Percentage values express the global methylation level in the U3 promoter region. MaLR[LTR] methylation percentages are shown in parentheses.
Figure 6
Figure 6
Effect of CpG methylation on MaLR[LTR]–ERVWE1[5′LTR] promoter strength. (A). Schematic representation of TSE-U3, U3 full-length and U3 minimal promoter constructs. Numbering starts from the first position in ERVWE1 5′LTR. Effective and putative transcription factor binding sites associated with the MaLR[LTR] TSE region (Sp-1, c-myb, GCMA, GATA), with the ERVWE1[5′LTR] U3 5′-subdomain (GATA, Pit-1a, ERalpha, Sp-1, Ap-2 and Oct-1), and CAAT and TATA boxes are indicated by black boxes. CpGs are depicted by circles on vertical bars. (B). Relative promoter activities in BeWo cells following in vitro methylation. pGL-LTR firefly luciferase plasmids were methylated in vitro during 30, 60 and 240 min, with and without -SAM. On the basis of restriction profiles with BstUI enzyme -SAM controls were, as expected, not methylated, and methylation level did not evolve anymore after 60 min indicating a similar methylation at 60 and 240 min. Plasmid methylated during 30 and 240 min and -SAM controls were transfected in BeWo b30 choriocarcinoma cells, which contain all the necessary factors for MaLR[LTR]–ERVWE1[5′LTR] promoter activity. Firefly luciferase activities were normalized to the activity of the co-transfected pRL-TK Renilla luciferase plasmids. The mean and standard deviation from at least three independent experiments are shown and expressed as a percentage of the maximal activity. Promoter activity of the vector backbone represents <0.3% of the larger TSE-U3 construct and <1.3% of the U3 minimal promoter construct (not shown).

Similar articles

Cited by

References

    1. Mager D. L., Medstrand P. Retroviral Repeat Sequences, Encyclopedia of Life Sciences. Chichester: John Wiley & Sons, Ltd; 2005.
    1. Lander E. S., Linton L. M., Birren B., Nusbaum C., Zody M. C., Baldwin J., et al. Initial sequencing and analysis of the human genome. Nature. 2001;409:860–921. - PubMed
    1. Prudhomme S., Bonnaud B., Mallet F. Endogenous retroviruses and animal reproduction. Cytogenet. Genome Res. 2005;110:353–364. - PubMed
    1. Leib-Mösch C., Seifarth W., Schön U. Influence of human endogenous retroviruses on cellular gene expression. In: Serdlov E., editor. Retroviruses and Primate Genome Evolution. Georgetown, Texas USA: Landes Bioscience; 2005. pp. 123–143.
    1. Gimenez J., Mallet F. ERVWE1 (Endogenous Retroviral family W, Env(C7), member 1) Atlas Genet. Cytogenet. Oncol. Haematol. 2007 http://AtlasGeneticsOncology.org/Genes/ERVWE1ID40497ch7q21.html .

Publication types

MeSH terms