. 2009 Sep 4;284(36):24443-52.
doi: 10.1074/jbc.M109.016006. Epub 2009 Jun 27.

FANCI protein binds to DNA and interacts with FANCD2 to recognize branched structures

Affiliations

FANCI protein binds to DNA and interacts with FANCD2 to recognize branched structures

Fenghua Yuan et al. J Biol Chem. .

Abstract

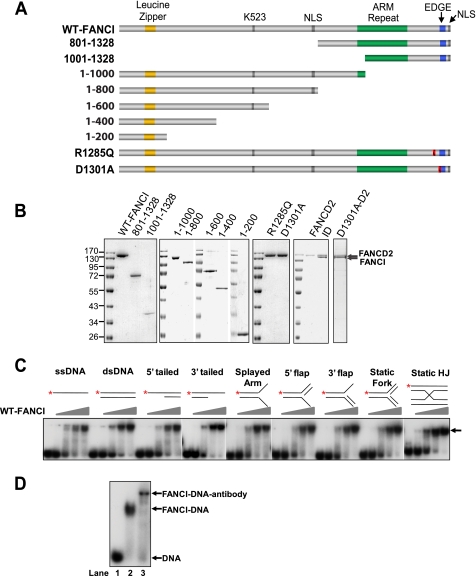
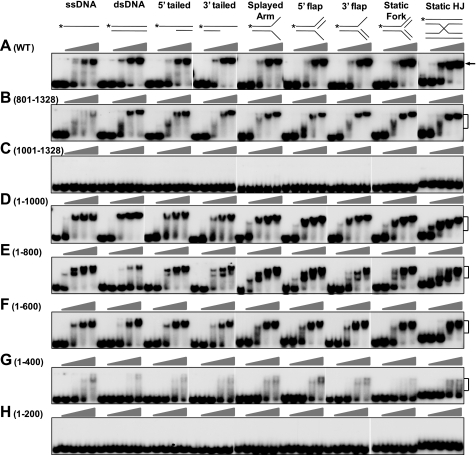
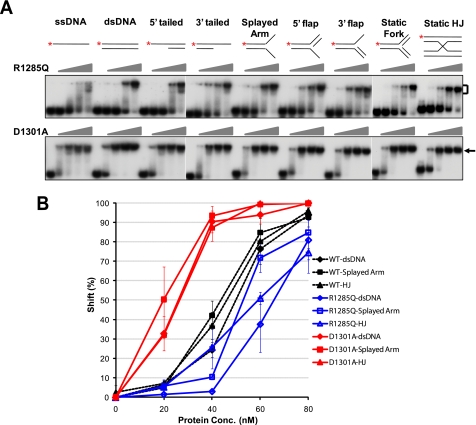
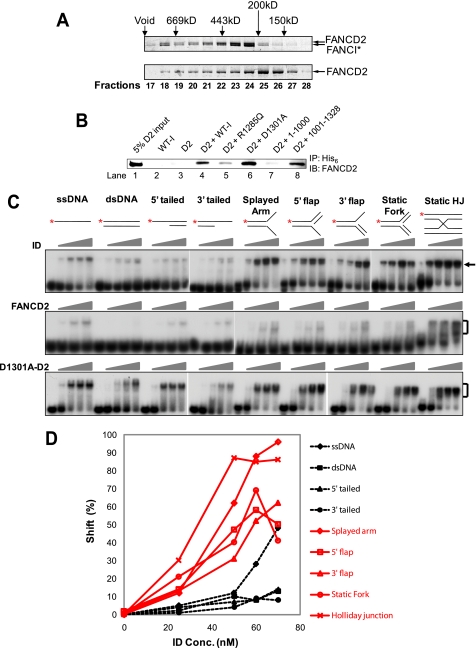
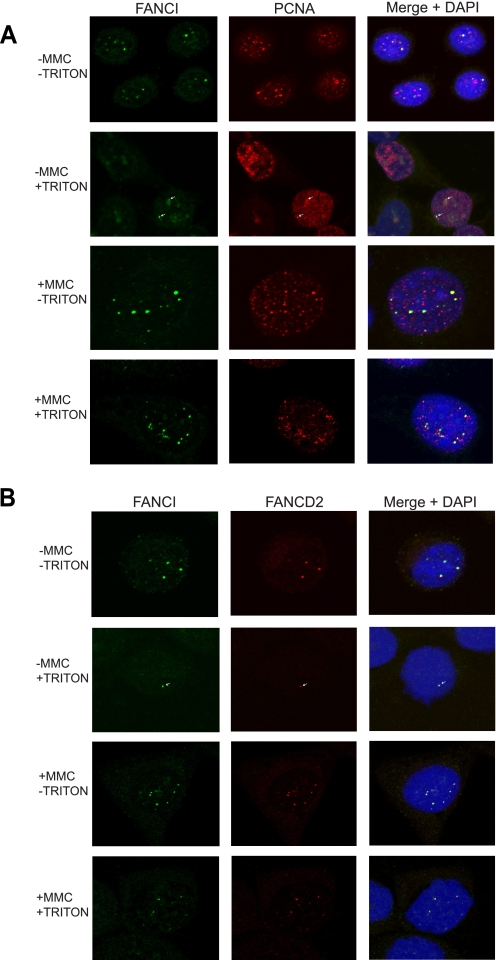
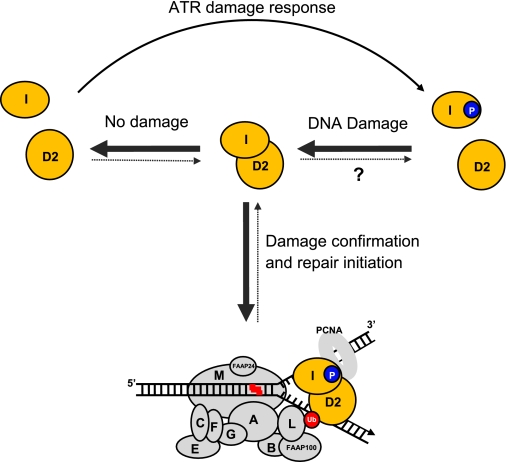
In this study, we report that the purified wild-type FANCI (Fanconi anemia complementation group I) protein directly binds to a variety of DNA substrates. The DNA binding domain roughly encompasses residues 200-1000, as suggested by the truncation study. When co-expressed in insect cells, a small fraction of FANCI forms a stable complex with FANCD2 (Fanconi anemia complementation group D2). Intriguingly, the purified FANCI-FANCD2 complex preferentially binds to the branched DNA structures when compared with either FANCI or FANCD2 alone. Co-immunoprecipitation with purified proteins indicates that FANCI interacts with FANCD2 through its C-terminal amino acid 1001-1328 fragment. Although the C terminus of FANCI is dispensable for direct DNA binding, it seems to be involved in the regulation of DNA binding activity. This notion is further enhanced by two C-terminal point mutations, R1285Q and D1301A, which showed differentiated DNA binding activity. We also demonstrate that FANCI forms discrete nuclear foci in HeLa cells in the absence or presence of exogenous DNA damage. The FANCI foci are colocalized perfectly with FANCD2 and partially with proliferating cell nuclear antigen irrespective of mitomycin C treatment. An increased number of FANCI foci form and become resistant to Triton X extraction in response to mitomycin C treatment. Our data suggest that the FANCI-FANCD2 complex may participate in repair of damaged replication forks through its preferential recognition of branched structures.


Figures

FIGURE 1.
FIGURE 1.
Purified human FANCI binds to DNA promiscuously. A, schematic diagram of predicted FANCI motifs and mutagenesis strategy to define the DNA binding domain. The ranges of numbers indicate how FANCI was truncated (e.g. 801–1328 represents FANCI-(801–1328)). NLS, predicted nuclear localization signal (aa 779–795 and 1323–1328); K523, lysine 523, the monoubiquitination site. The leucine zipper (orange bars, aa 130–151), ARM repeats (green bars), and EDGE motif (blue bars) are indicated. Red bars with a slash indicate the point mutations shown on the left. B, SDS-PAGE of the purified proteins stained with Coomassie Brilliant Blue R-250. R1285Q and D1301A are two point mutants of FANCI. All FANCI variants are tagged by hexahistidine. FANCD2 is in its native form. Protein markers in kilodaltons are indicated. C, titration of WT-FANCI for the DNA binding activity. Diagrams of the DNA substrates are shown at the top of each set of reactions. *, 32P-labeled 5′-end. HJ, Holliday junction. Concentrations of FANCI were 0, 20, 40, 60, and 80 nm (ascending triangles). The substrate concentration was 1 nm. Protein-DNA complex is indicated by an arrow. D, supershift assay. 1 nm of ssDNA was incubated with PBS (lane 1), 80 nm FANCI alone (lane 2), and 80 nm FANCI preincubated with a specific FANCI antibody (lane 3) in the condition described under “Experimental Procedures.”
FIGURE 2.
FIGURE 2.
DNA binding domain of FANCI. EMSAs were performed with titration of the indicated FANCI truncation mutants. Concentrations of the mutants were 0, 20, 40, 60, and 80 nm (ascending triangles). The substrate concentration was 1 nm. Diagrams of the DNA substrates are shown at the top of each set of reactions. *, 32P-labeled 5′-end. Brackets, protein-DNA complex. A, WT-FANCI was included for convenient comparison. B, FANCI-(801–1328). C, FANCI-(1001–1328). D, FANCI-(1–1000). E, FANCI-(1–800). F, FANCI-(1–600). G, FANCI-(1–400). H, FANCI-(1–200). WT, wild type.
FIGURE 3.
FIGURE 3.
DNA binding activity of FANCI R1285Q and D1301A. A, EMSAs of FANCI R1285Q and D1301A. Concentrations of the mutants were 0, 20, 40, 60, and 80 nm (ascending triangles). The substrate concentration was 1 nm. Diagrams of the DNA substrates are shown at the top of each set of reactions. *, 32P-labeled 5′-end. Protein-DNA complex is indicated by a bracket or an arrow. B, quantitation of the DNA binding activity of WT-FANCI, R1285Q, and D1301A to dsDNA, splayed arm, and Holliday junction (HJ). All experiments were repeated at least three times. Error bars, S.D. values. Broken lines with filled markers, WT-FANCI; blue solid lines with open markers, R1285Q; red solid lines with filled markers, D1301A. WT, wild type.
FIGURE 4.
FIGURE 4.
FANCI interacts with FANCD2 to recognize branched structures. A, SDS-PAGE of the ID complex (314 kDa) and FANCD2 (164 kDa) alone on the Superdex 200 column. The column calibration was performed with blue dextran for void volume and a series of molecular weight markers (Sigma). The peaks of each marker in kilodaltons are approximately marked at the top. Fraction numbers (0.5 ml/tube) are marked at the bottom. FANCI and FANCD2 are indicated by arrows. *, His6 tag. B, co-immunoprecipitation of FANCI mutants with FANCD2. All FANCI mutants were tagged with His6. The antibody used for pull-down (IP) was an anti-His6 antibody (Calbiochem). The antibody used for detection (IB) was a FANCD2-specific antibody. WT-I, wild-type FANCI; D2, FANCD2. R1285Q, D1301A, 1–1000, and 1001–1328 are different mutants of FANCI. C, DNA binding activity of the ID complexes and FANCD2. EMSAs were performed with titration of the indicated protein mutants. Concentrations of the wild-type ID complex and D1301A-FANCD2 complex were 0, 25, 50, 60, and 70 nm (ascending triangles). Concentrations of FANCD2 were 0, 50, 100, and 150 nm (ascending triangles). The substrate concentration was 1 nm. Diagrams of the DNA substrates are shown at the top of each set of reactions. *, 32P-labeled 5′-end. Protein-DNA complex is indicated by a bracket or an arrow. D, quantitation of the DNA binding by the wild-type ID complex in C. Red solid lines with open markers, branched structures. Broken lines with filled markers, non-branched structures.
FIGURE 5.
FIGURE 5.
FANCI forms nuclear foci and colocalizes with PCNA and FANCD2 in the absence or presence of DNA damage. Methanol-fixed cells with or without Triton X-100 pre-extraction were stained pairwise with either FANCI- and PCNA-specific antibodies (A), or FANCI- and FANCD2-specific antibodies (B). The stained cells were subject to confocal microscopy. Because the Triton X extraction dramatically reduced the fluorescence signal of FANCI in the absence of MMC treatment, we presented a two-dimensional view of a three-dimensional reconstruction of multifocal plane images to enhance the signal. The images in the −MMC +Triton panels of both A and B reflect overall signal level of the whole cell. Other panels represent a two-dimensional view of one focal plane image. Green, FANCI. Red, PCNA or FANCD2. Yellow and arrows, colocalization. Nuclei were stained with 4′,6-diamidino-2-phenylindole (DAPI) (blue).
FIGURE 6.
FIGURE 6.
A working model for the role of FANCI DNA binding in ICL repair. An equilibrium of FANCI and FANCD2 interaction exists to sense DNA damage level that stalls replication forks in a cell. When DNA damage level is high, more ID complex will be formed and bound to stalled replication forks. The phosphorylation of FANCI could promote ID complex formation. The ID complex bound to the stalled fork will then be monoubiquitinated by the translocating FA core and therefore recruits downstream factors to initiate repair. When the damage is repaired or when the cells are free of damage, FANCI and FANCD2 in the ID complex tend to dissociate from each other because of dephosphorylation and deubiquitination. The hypothesized tendency of balance shift is indicated by either boldface solid arrows (association) or broken thin arrows (dissociation). A question mark denotes that this step is fully hypothetical without any direct evidence. FANCI and FANCD2 are highlighted with orange. The FA core complex with 10 subunits is depicted using gray ovals with their FA group letters. FANCL is the ubiquitin ligase. Red zigzag line, interstrand cross-link. Blue circle with the letter P, phosphorylation. Red circle with Ub, monoubiquitination.

References

    1. Alter B. P., Greene M. H., Velazquez I., Rosenberg P. S. (2003) Blood 101, 2072. - PubMed
    1. de Winter J. P., Joenje H. (2009) Mutat. Res. 668, 11–19 - PubMed
    1. Joenje H., Patel K. J. (2001) Nat. Rev. Genet. 2, 446–457 - PubMed
    1. Kennedy R. D., D'Andrea A. D. (2005) Genes Dev. 19, 2925–2940 - PubMed
    1. Kutler D. I., Singh B., Satagopan J., Batish S. D., Berwick M., Giampietro P. F., Hanenberg H., Auerbach A. D. (2003) Blood 101, 1249–1256 - PubMed

Publication types

MeSH terms

Substances

LinkOut - more resources