

Absolute metabolite concentrations and implied enzyme active site occupancy in Escherichia coli
- PMID: 19561621
- PMCID: PMC2754216
- DOI: 10.1038/nchembio.186
Absolute metabolite concentrations and implied enzyme active site occupancy in Escherichia coli
Abstract
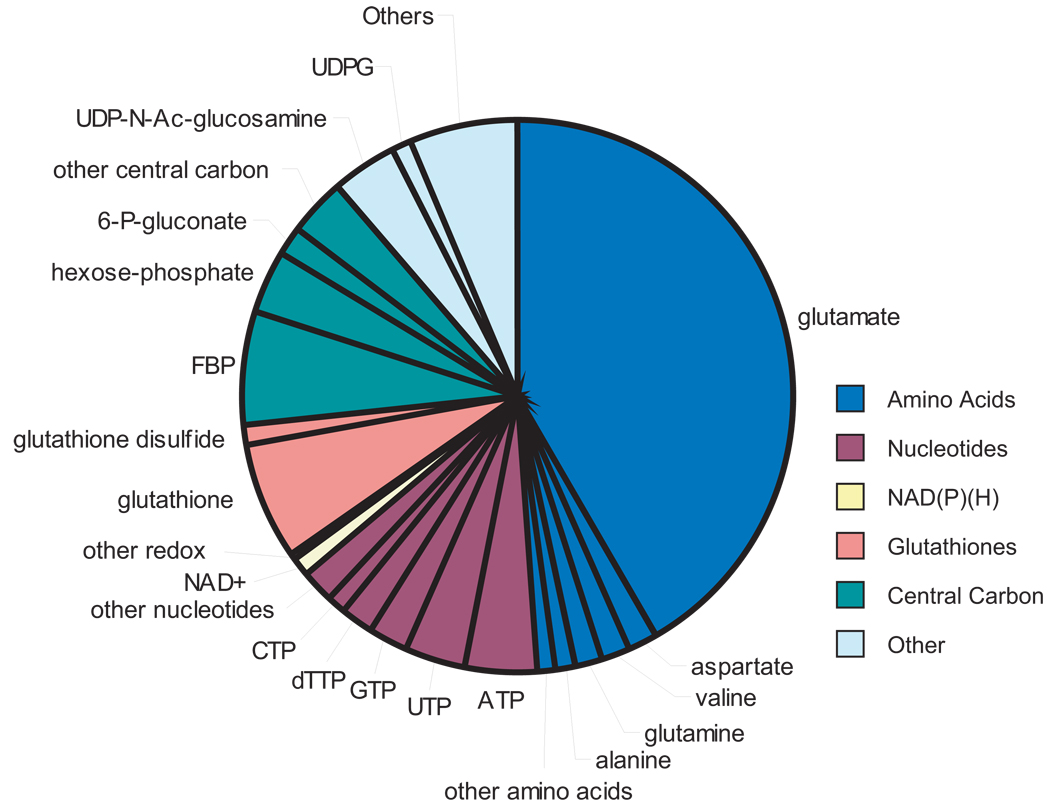
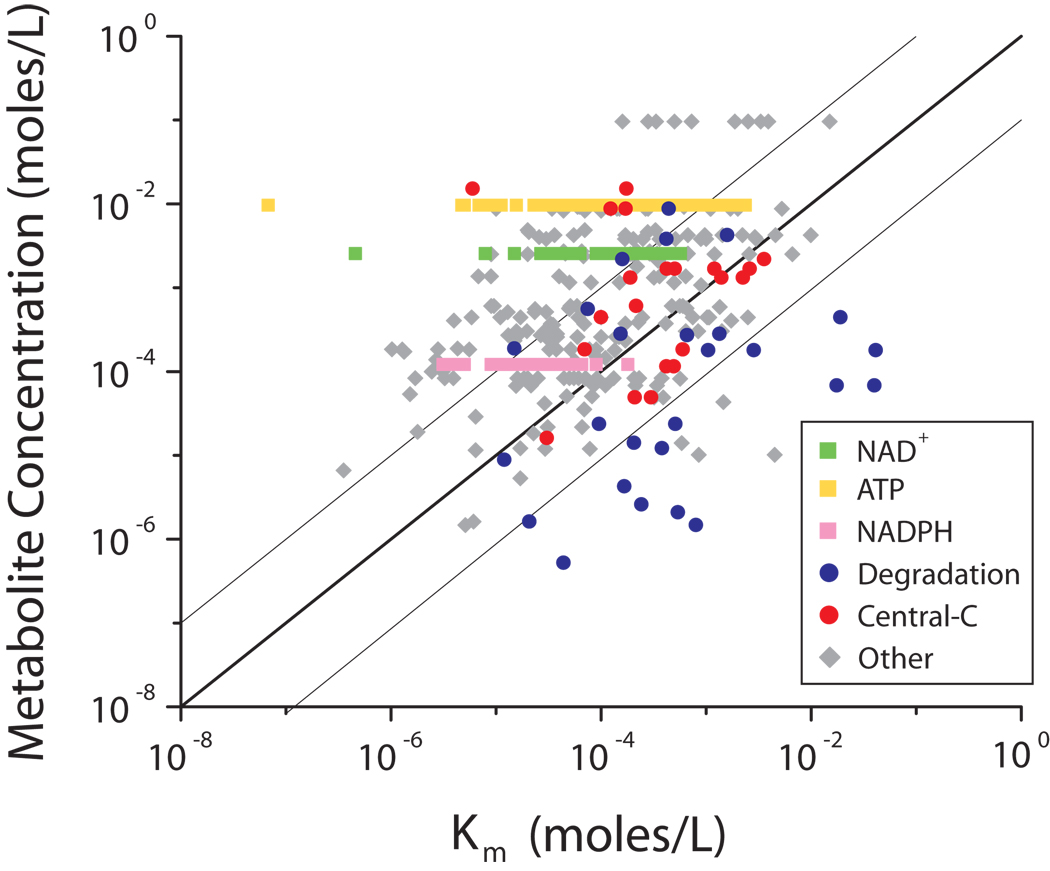
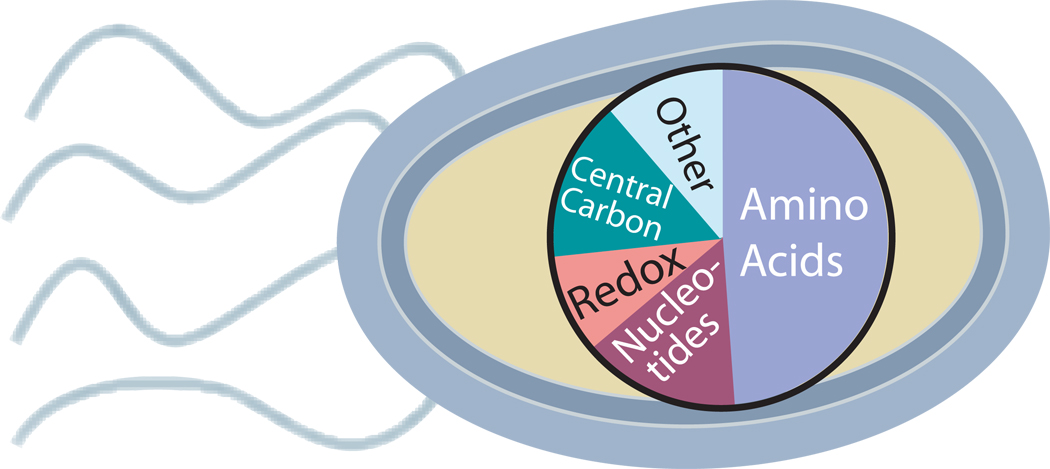
Absolute metabolite concentrations are critical to a quantitative understanding of cellular metabolism, as concentrations impact both the free energies and rates of metabolic reactions. Here we use LC-MS/MS to quantify more than 100 metabolite concentrations in aerobic, exponentially growing Escherichia coli with glucose, glycerol or acetate as the carbon source. The total observed intracellular metabolite pool was approximately 300 mM. A small number of metabolites dominate the metabolome on a molar basis, with glutamate being the most abundant. Metabolite concentration exceeds K(m) for most substrate-enzyme pairs. An exception is lower glycolysis, where concentrations of intermediates are near the K(m) of their consuming enzymes and all reactions are near equilibrium. This may facilitate efficient flux reversibility given thermodynamic and osmotic constraints. The data and analyses presented here highlight the ability to identify organizing metabolic principles from systems-level absolute metabolite concentration data.
Figures
Comment in
-
A metabolic network described in absolute terms.Nat Chem Biol. 2009 Aug;5(8):535-6. doi: 10.1038/nchembio0809-535. Nat Chem Biol. 2009. PMID: 19620991 No abstract available.
References
-
- Bajad SU, et al. Separation and quantitation of water soluble cellular metabolites by hydrophilic interaction chromatography-tandem mass spectrometry. J Chromatogr A. 2006;1125:76–88. - PubMed
-
- Coulier L, et al. Simultaneous quantitative analysis of metabolites using ion-pair liquid chromatography-electrospray ionization mass spectrometry. Anal Chem. 2006;78:6573–6582. - PubMed
-
- Luo B, Groenke K, Takors R, Wandrey C, Oldiges M. Simultaneous determination of multiple intracellular metabolites in glycolysis, pentose phosphate pathway and tricarboxylic acid cycle by liquid chromatography-mass spectrometry. J Chromatogr A. 2007;1147:153–164. - PubMed
Publication types
MeSH terms
Substances
Associated data
- PubChem-Substance/81044481
- PubChem-Substance/81044482
- PubChem-Substance/81044483
- PubChem-Substance/81044484
- PubChem-Substance/81044485
- PubChem-Substance/81044486
- PubChem-Substance/81044487
- PubChem-Substance/81044488
- PubChem-Substance/81044489
- PubChem-Substance/81044490
- PubChem-Substance/81044491
- PubChem-Substance/81044492
- PubChem-Substance/81044493
- PubChem-Substance/81044494
- PubChem-Substance/81044495
- PubChem-Substance/81044496
- PubChem-Substance/81044497
- PubChem-Substance/81044498
- PubChem-Substance/81044499
- PubChem-Substance/81044500
- PubChem-Substance/81044501
- PubChem-Substance/81044502
- PubChem-Substance/81044503
- PubChem-Substance/81044504
- PubChem-Substance/81044505
- PubChem-Substance/81044506
- PubChem-Substance/81044507
- PubChem-Substance/81044508
- PubChem-Substance/81044509
- PubChem-Substance/81044510
- PubChem-Substance/81044511
- PubChem-Substance/81044512
- PubChem-Substance/81044513
- PubChem-Substance/81044514
- PubChem-Substance/81044515
- PubChem-Substance/81044516
- PubChem-Substance/81044517
- PubChem-Substance/81044518
- PubChem-Substance/81044519
- PubChem-Substance/81044520
- PubChem-Substance/81044521
- PubChem-Substance/81044522
- PubChem-Substance/81044523
- PubChem-Substance/81044524
- PubChem-Substance/81044525
- PubChem-Substance/81044526
- PubChem-Substance/81044527
- PubChem-Substance/81044528
- PubChem-Substance/81044529
- PubChem-Substance/81044530
- PubChem-Substance/81044531
- PubChem-Substance/81044532
- PubChem-Substance/81044533
- PubChem-Substance/81044534
- PubChem-Substance/81044535
- PubChem-Substance/81044536
- PubChem-Substance/81044537
- PubChem-Substance/81044538
- PubChem-Substance/81044539
- PubChem-Substance/81044540
- PubChem-Substance/81044541
- PubChem-Substance/81044542
- PubChem-Substance/81044543
- PubChem-Substance/81044544
- PubChem-Substance/81044545
- PubChem-Substance/81044546
- PubChem-Substance/81044547
- PubChem-Substance/81044548
- PubChem-Substance/81044549
- PubChem-Substance/81044550
- PubChem-Substance/81044551
- PubChem-Substance/81044552
- PubChem-Substance/81044553
- PubChem-Substance/81044554
- PubChem-Substance/81044555
- PubChem-Substance/81044556
- PubChem-Substance/81044557
- PubChem-Substance/81044558
- PubChem-Substance/81044559
- PubChem-Substance/81044560
- PubChem-Substance/81044561
- PubChem-Substance/81044562
- PubChem-Substance/81044563
- PubChem-Substance/81044564
- PubChem-Substance/81044565
- PubChem-Substance/81044566
- PubChem-Substance/81044567
- PubChem-Substance/81044568
- PubChem-Substance/81044569
- PubChem-Substance/81044570
- PubChem-Substance/81044571
- PubChem-Substance/81044572
- PubChem-Substance/81044573
- PubChem-Substance/81044574
- PubChem-Substance/81044575
- PubChem-Substance/81044576
- PubChem-Substance/81044577
- PubChem-Substance/81044578
- PubChem-Substance/81044579
- PubChem-Substance/81044580
- PubChem-Substance/81044581
- PubChem-Substance/81044582
- PubChem-Substance/81044583
- PubChem-Substance/81044584
- PubChem-Substance/81044585
- PubChem-Substance/81044586
- PubChem-Substance/81044587
- PubChem-Substance/81044588
- PubChem-Substance/81044589
- PubChem-Substance/81044590
- PubChem-Substance/81044591
- PubChem-Substance/81044592
- PubChem-Substance/81044593
- PubChem-Substance/81044594
- PubChem-Substance/81044595
Grants and funding
LinkOut - more resources
Full Text Sources
Other Literature Sources
Molecular Biology Databases
