

A Review of Challenges in the Use of fMRI for Disease Classification / Characterization and A Projection Pursuit Application from Multi-site fMRI Schizophrenia Study
- PMID: 19562043
- PMCID: PMC2701746
- DOI: 10.1007/s11682-008-9028-1
A Review of Challenges in the Use of fMRI for Disease Classification / Characterization and A Projection Pursuit Application from Multi-site fMRI Schizophrenia Study
Abstract
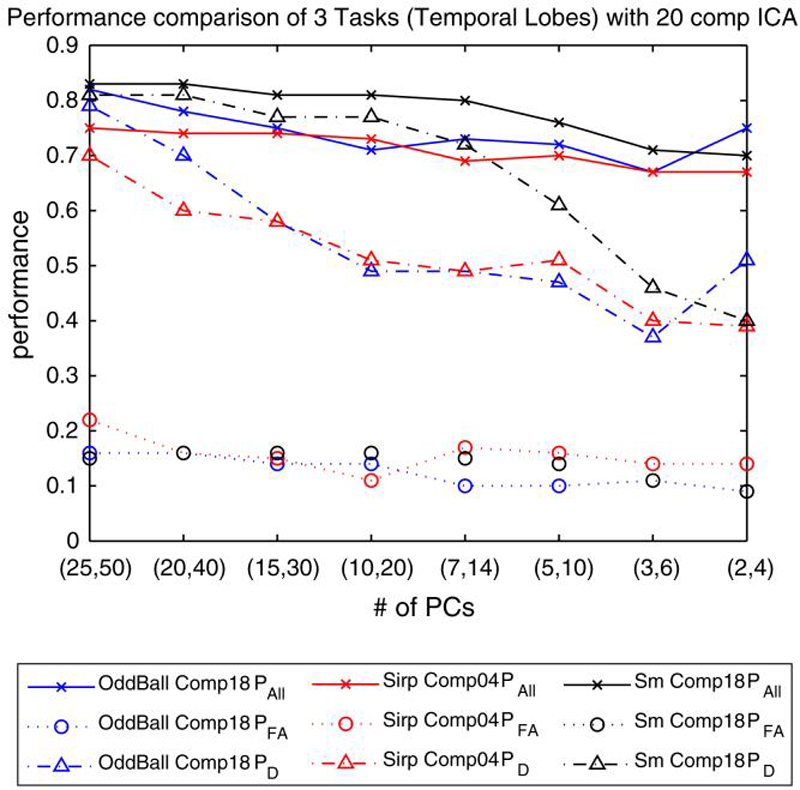
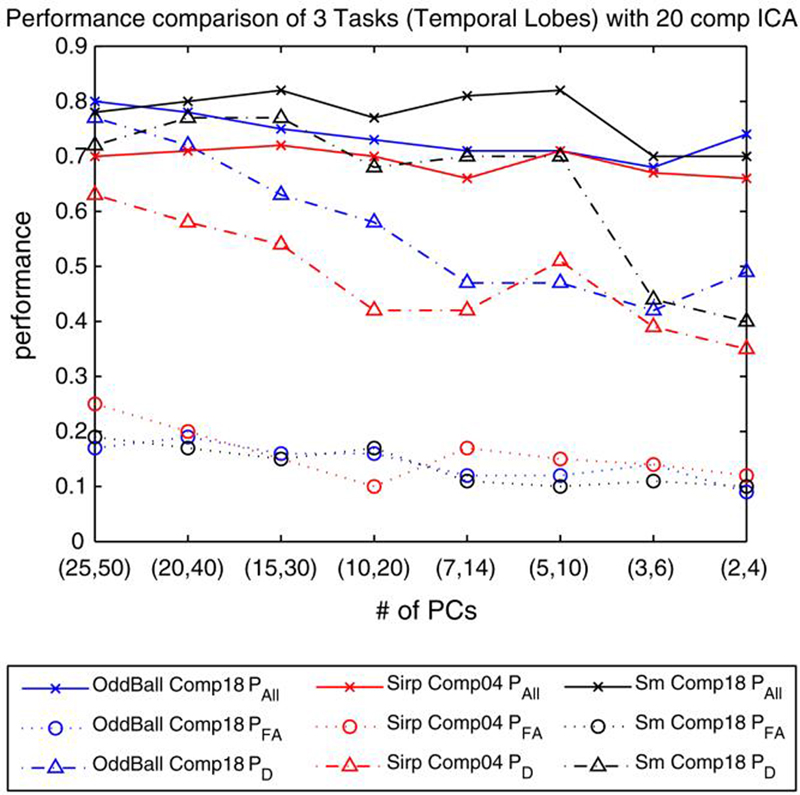
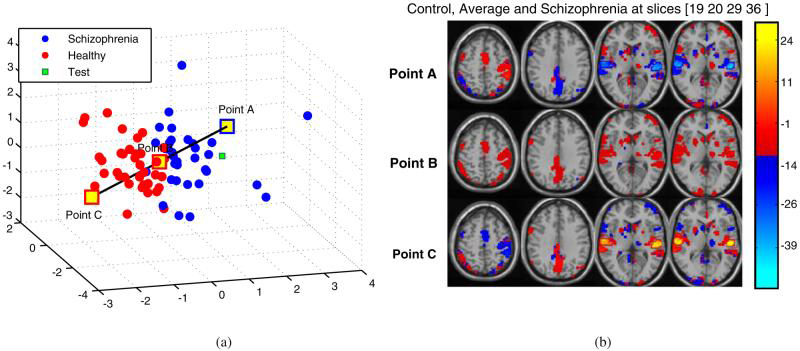
Functional magnetic resonance imaging (fMRI) is a fairly new technique that has the potential to characterize and classify brain disorders such as schizophrenia. It has the possibility of playing a crucial role in designing objective prognostic/diagnostic tools, but also presents numerous challenges to analysis and interpretation. Classification provides results for individual subjects, rather than results related to group differences. This is a more complicated endeavor that must be approached more carefully and efficient methods should be developed to draw generalized and valid conclusions out of high dimensional data with a limited number of subjects, especially for heterogeneous disorders whose pathophysiology is unknown. Numerous research efforts have been reported in the field using fMRI activation of schizophrenia patients and healthy controls. However, the results are usually not generalizable to larger data sets and require careful definition of the techniques used both in designing algorithms and reporting prediction accuracies. In this review paper, we survey a number of previous reports and also identify possible biases (cross-validation, class size, e.g.) in class comparison/prediction problems. Some suggestions to improve the effectiveness of the presentation of the prediction accuracy results are provided. We also present our own results using a projection pursuit algorithm followed by an application of independent component analysis proposed in an earlier study. We classify schizophrenia versus healthy controls using fMRI data of 155 subjects from two sites obtained during three different tasks. The results are compared in order to investigate the effectiveness of each task and differences between patients with schizophrenia and healthy controls were investigated.
Figures
References
-
- Baddeley A. Working memory. Science. 1992;255(5044):556–559. - PubMed
-
- Bellman R. Adaptive control processes - A guided tour. Princeton University Press; Princeton: 1961. p. 255.
-
- Braff DL. Information processing and attention dysfunctions in schizophrenia. Schizophrenia Bulletin. 1993;19:233–259. - PubMed
-
- Calhoun VD, Adali T, Pearlson GD, Pekar J. ICA2001. San Diego, CA: 2001a. Group ica of functional MRI data: Separability, stationarity, and inference.
Grants and funding
LinkOut - more resources
Full Text Sources