. 2007 Apr 1;55(7):2479-2488.
doi: 10.1016/j.actamat.2006.11.042.

Design maps for failure of all-ceramic layer structures in concentrated cyclic loading

Affiliations

Design maps for failure of all-ceramic layer structures in concentrated cyclic loading

Sanjit Bhowmick et al. Acta Mater. .

Abstract

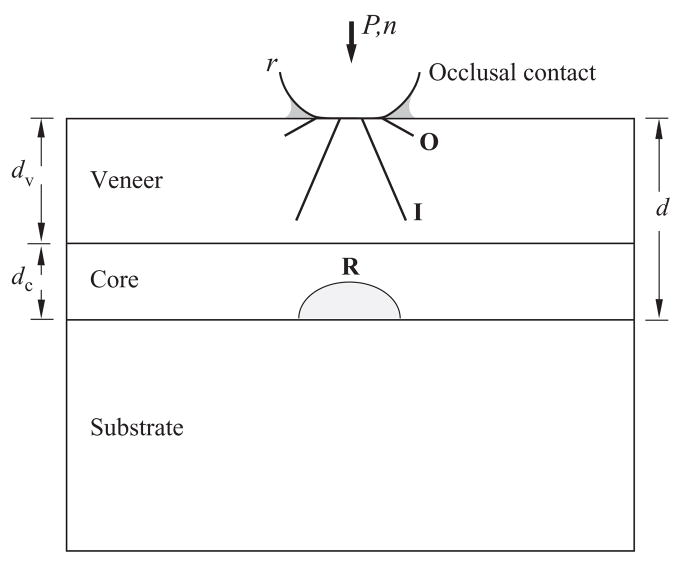
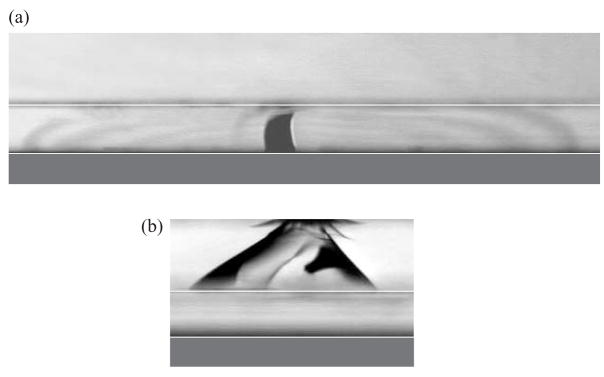
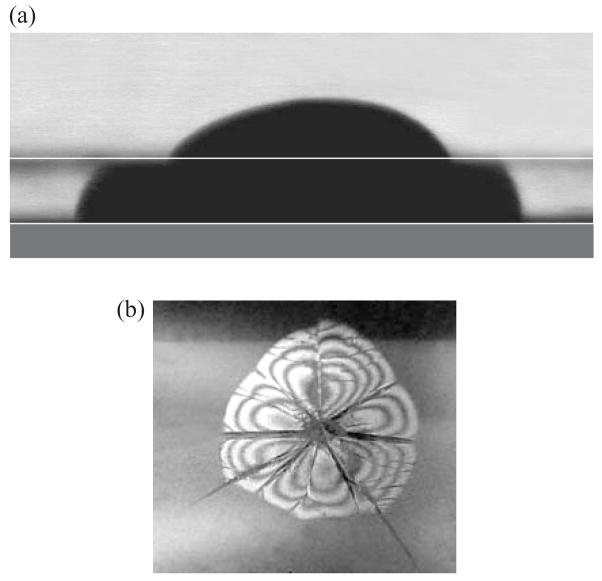
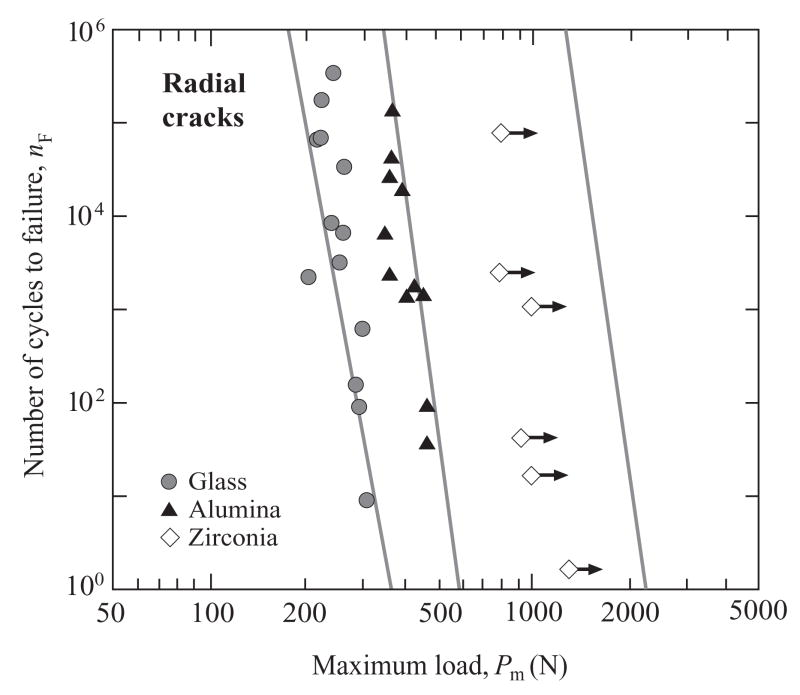
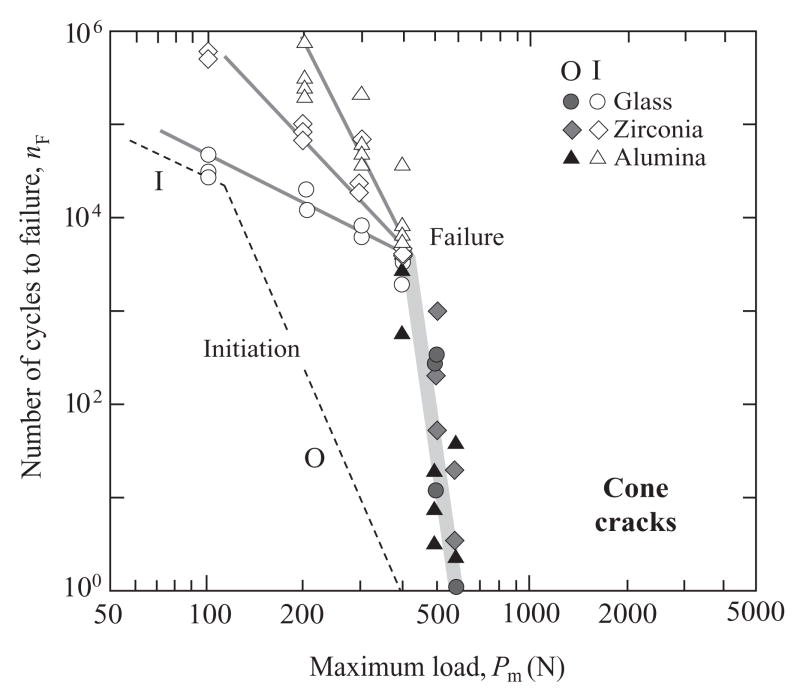
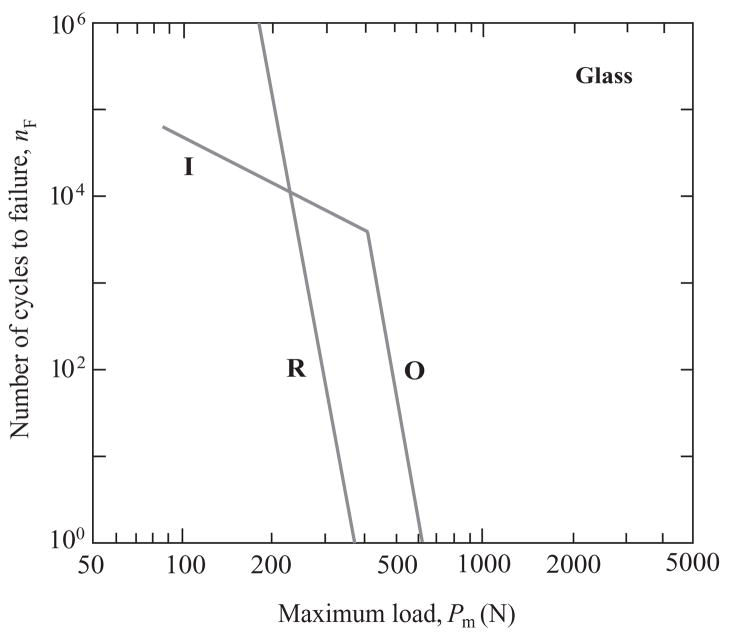
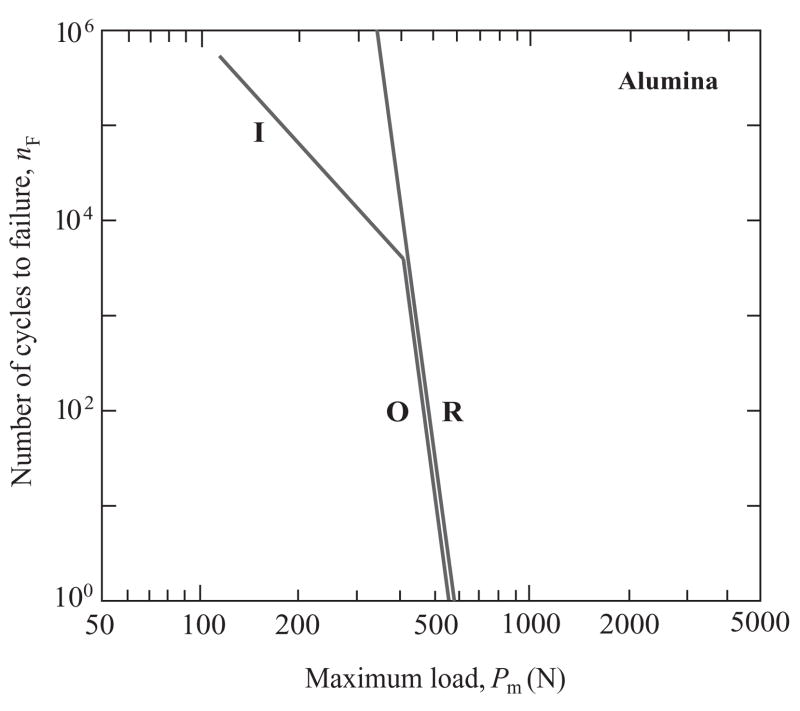
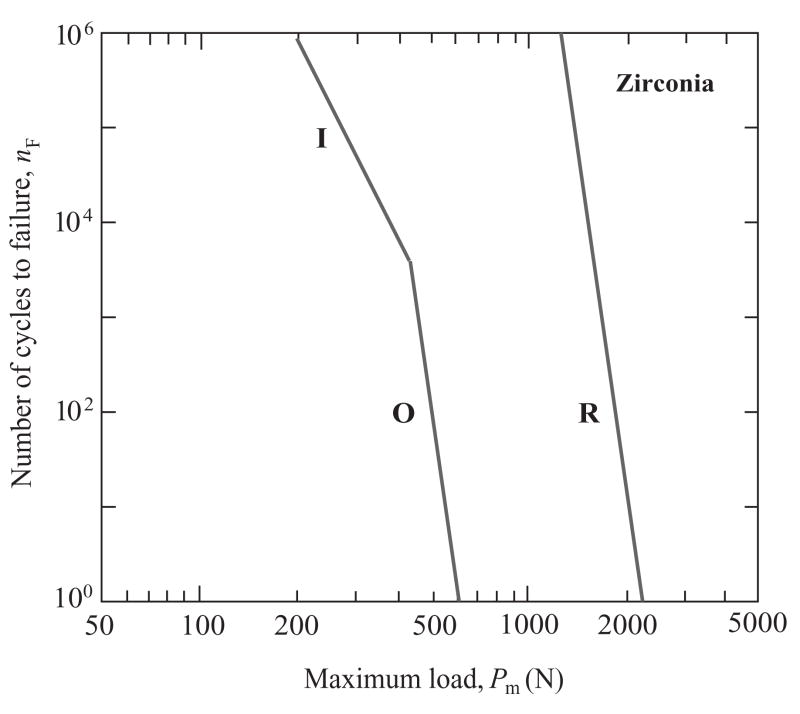
A study is made of the competition between failure modes in ceramic-based bilayer structures joined to polymer-based substrates, in simulation of dental crown-like structures with a functional but weak "veneer" layer bonded onto a strong "core" layer. Cyclic contact fatigue tests are conducted in water on model flat systems consisting of glass plates joined to glass, sapphire, alumina or zirconia support layers glued onto polycarbonate bases. Critical numbers of cycles to take each crack mode to failure are plotted as a function of peak contact load on failure maps showing regions in which each fracture mode dominates. In low-cycle conditions, radial and outer cone cracks are competitive in specimens with alumina cores, and outer cone cracks prevail in specimens with zirconia cores; in high-cycle conditions, inner cone cracks prevail in all cases. The roles of other factors, e.g. substrate modulus, layer thickness, indenter radius and residual stresses from specimen preparation, are briefly considered.


Figures

Fig. 1
Fig. 1
Schematic showing competing outer (O) and inner (I) cone cracks in the veneer layer and radial cracks (R) in the core, with net layer thickness d = dv + dc, bonded to a compliant support base. The specimen is loaded with spheres of radius r at load P for number of cycles n in water (shaded).
Fig. 2
Fig. 2
Failure crack morphologies in glass/sapphire/polycarbonate trilayers, from contact with WC spheres of radius r = 5.0 mm. (a) Core radial cracking in the bottom-surface abraded sapphire at Pm = 400 N and nF = 1014 cycles. For this crack mode, initiation and penetration occur simultaneously. (b) Veneer cone cracking in the top-surface abraded glass layer, showing dominant I cracks at Pm = 300 N and nF = 43613 cycles. For this mode, initiation generally occurs at a relatively low number of cycles, and the crack propagates stably prior to failure. Interfaces are accentuated by superimposed white lines, for clarification.
Fig. 3
Fig. 3
Crack morphology in glass/sapphire/polycarbonate trilayers with bottom-surface abraded sapphire, showing subsidiary modes after failure by core radial cracking. (a) Reinitiation of the radial crack in an adjacent underabraded veneer layer. Indentation at Pm = 375 N, after n = 4129 cycles. (b) Delamination at the interface, indicated by a fringe pattern. Note how the delamination pattern is constrained by foregoing radials. Indentation at Pm = 375 N, after n = 3261 cycles.
Fig. 4
Fig. 4
Number of cycles nF to contact-induced core failure from R radial cracks for epoxy-bonded glass/ceramic/polycarbonate trilayers, as a function of maximum contact load Pm, WC sphere r = 5.0 mm. Data are shown for glass, alumina and zirconia cores. Lines are predictions using Eqs. (2) and (3) in conjunction with data from Table 1.
Fig. 5
Fig. 5
Number of cycles nF to contact-induced veneer failure from O and I cone cracks for epoxy-bonded glass/ceramic/polycarbonate trilayers, as a function of maximum contact load Pm, WC sphere r = 5. 0 mm. Failure data are shown for glass, alumina and zirconia cores. The lines through the O crack data are in accordance with Eq. (4), using N values from Table 1 and adjusting PO for each core material to give best fits. The lines through the I crack data are empirical fits to data. The dashed lines at the left are corresponding (material-independent) crack initiation functions (from [35]).
Fig. 6
Fig. 6
Number of cycles nF to contact-induced veneer failure from O and I cone cracks vs. core failure from R radial cracks, for glass/glass/polycarbonate trilayers, as a function of maximum contact load Pm. The lines are from Figs. 4 and 5, data omitted.
Fig. 7
Fig. 7
Number of cycles nF to contact-induced veneer failure from O and I cone cracks vs. core failure from R radial cracks, for glass/alumina/polycarbonate trilayers, as a function of maximum contact load Pm. The lines are from Figs. 4 and 5, data omitted.
Fig. 8
Fig. 8
Number of cycles nF to contact-induced veneer failure from O and I cone cracks vs. core failure from R radial cracks, for glass/zirconia/polycarbonate trilayers, as a function of maximum contact load Pm. The lines are from Figs. 4 and 5, data omitted.
Fig. B1
Fig. B1
Schematic of cone crack evolution c(n) through veneer, showing the critical number of cycles nI needed to initiate cracks, to reach the steady state stage and to reach failure nF.

References

    1. Diao DF, Kato K, Hokkirigawa K. Trans ASME J Tribol. 1994;116:860.
    1. Lardner TJ, Ritter JE, Zhu G-Q. Journal of the American Ceramic Society. 1997;80:1851.
    1. Wakabayashi N, Anusavice KJ. Journal of Dental Research. 2000;79:1398. - PubMed
    1. Miranda P, Pajares A, Guiberteau F, Cumbrera FL, Lawn BR. Journal of Materials Research. 2001;16:115.
    1. Deng Y, Lawn BR, Lloyd IK. Journal of Biomedical Materials Research. 2002;63B:137. - PubMed

LinkOut - more resources