. 2009 Jun 26;137(7):1235-46.
doi: 10.1016/j.cell.2009.04.024.

Abnormal behavior in a chromosome-engineered mouse model for human 15q11-13 duplication seen in autism

Affiliations

Abnormal behavior in a chromosome-engineered mouse model for human 15q11-13 duplication seen in autism

Jin Nakatani et al. Cell. .

Abstract

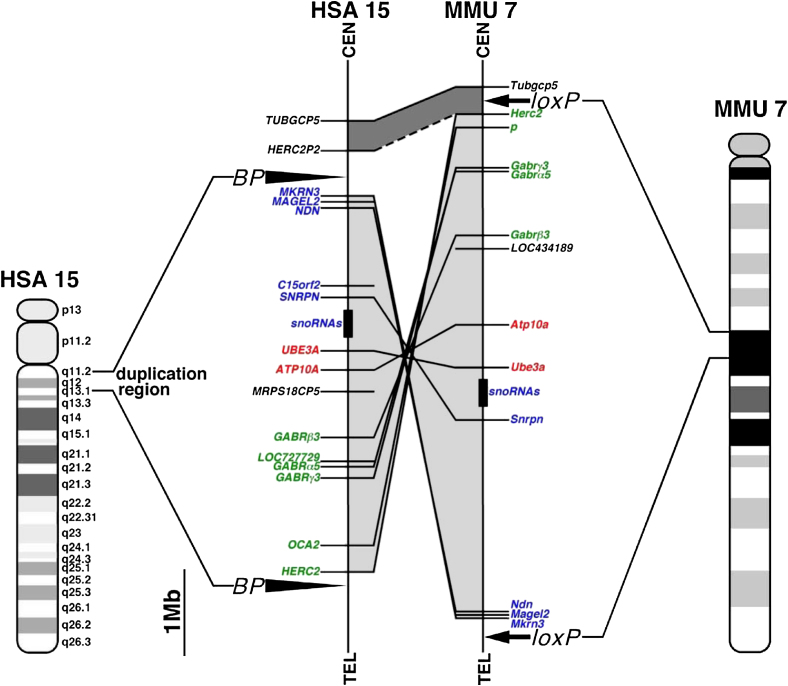
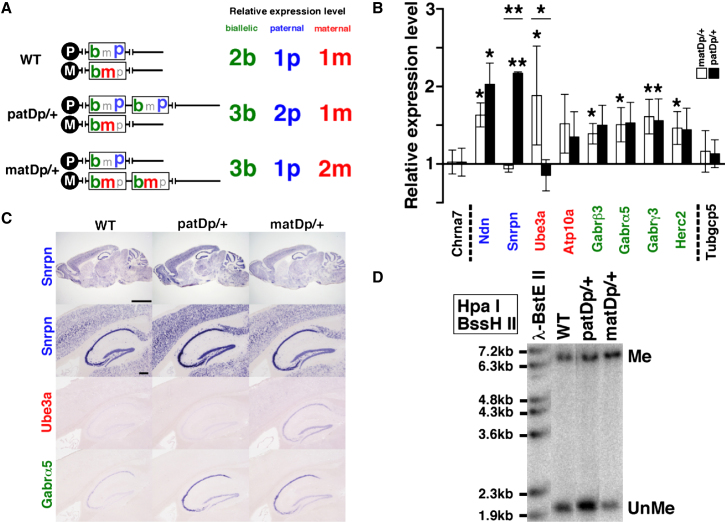
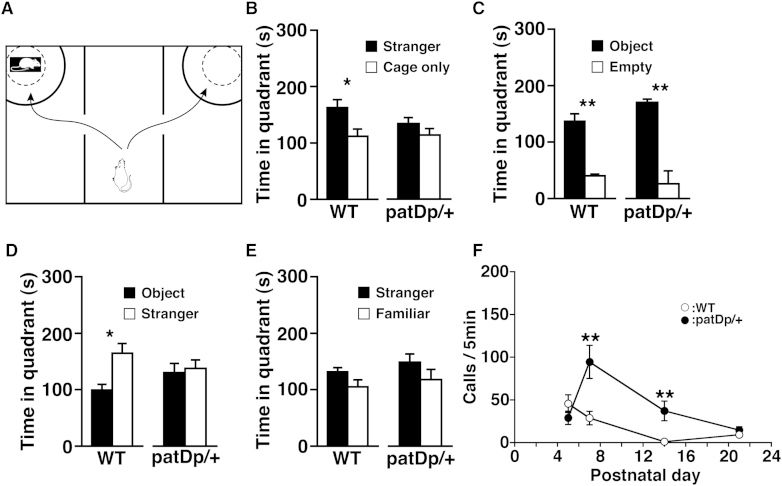
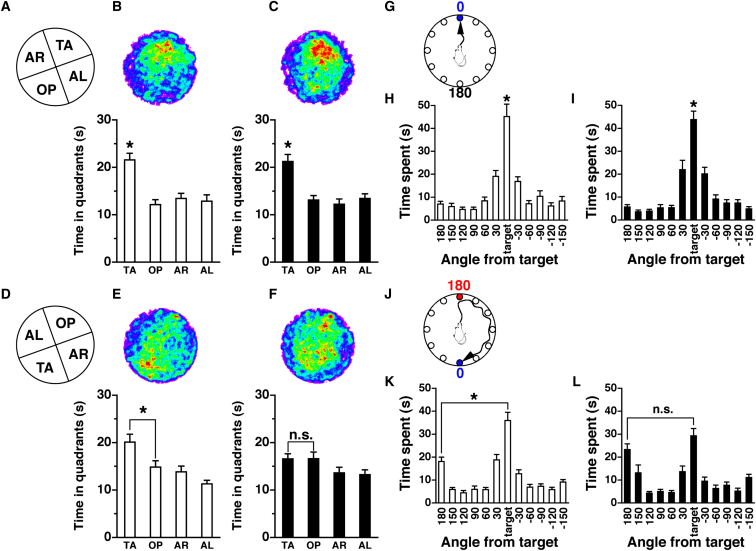
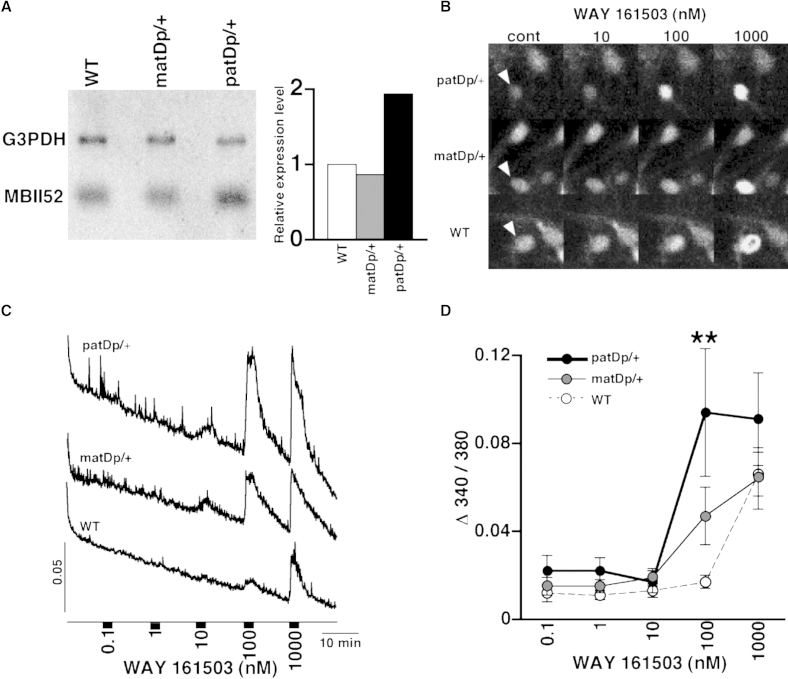
Substantial evidence suggests that chromosomal abnormalities contribute to the risk of autism. The duplication of human chromosome 15q11-13 is known to be the most frequent cytogenetic abnormality in autism. We have modeled this genetic change in mice by using chromosome engineering to generate a 6.3 Mb duplication of the conserved linkage group on mouse chromosome 7. Mice with a paternal duplication display poor social interaction, behavioral inflexibility, abnormal ultrasonic vocalizations, and correlates of anxiety. An increased MBII52 snoRNA within the duplicated region, affecting the serotonin 2c receptor (5-HT2cR), correlates with altered intracellular Ca(2+) responses elicited by a 5-HT2cR agonist in neurons of mice with a paternal duplication. This chromosome-engineered mouse model for autism seems to replicate various aspects of human autistic phenotypes and validates the relevance of the human chromosome abnormality. This model will facilitate forward genetics of developmental brain disorders and serve as an invaluable tool for therapeutic development.


Figures

Figure 1
Figure 1
Human Chromosome 15q11-13 and Mouse Chromosome 7 Schematic representation of the genomic regions in the human and mouse genomes. Details of conserved linkage in human 15q11-13 and mouse chromosome 7 are shown. The paternally, maternally expressed, and nonimprinting genes were labeled with blue, red, and green, respectively. The two arrowheads (BP) represent the common breakpoints, and the two arrows represent the targeting sites of 2 loxP sequences. Genomic segments that show linkage conservation (i.e., identical gene order) in humans and mice are connected by dark shading if the gene orders are in the same direction relative to their respective centromeres. If the gene orders in the syntenic segments are in opposite orientations, they are connected by light shading.
Figure 2
Figure 2
Engineering an Interstitial Duplication on Chromosome 7 (A) Insertional double targeting and genomic coordinates, NCBI build m37. S, SacI; T, Tth111I. (B) Southern blot analysis of ES cell DNA samples. (C) Cre/loxP recombination generates duplication and deletion chromosomes. (D) Southern blot analysis of ES cell DNA confirming the duplication. (E) Confirmation by FISH. The probes used are shown on the left. The red and green bars represent the probes located within and outside the duplicated region, respectively. The white arrow and arrowhead represent the Dp and Df alleles, respectively. (F) A BAC array-CGH profile of chromosome 7 from mice with the duplication. Log2-transformed hybridization ratios of duplicated mouse DNA versus WT DNA are plotted.
Figure 3
Figure 3
Gene Expression in Mice with the Duplication (A) Expected gene expression levels in wild-type (WT), paternal duplication (patDp/+), and maternal duplication (matDp/+) mice. (B) mRNA expression in the mouse adult brain of the listed genes analyzed by quantitative RT-PCR. The relative expression levels of patDp/+ (n = 4) and matDp/+ (n = 4) were compared with WT (n = 7) normalized to 1.0. Blue, red, and green indicate paternally expressed, maternally expressed, and nonimprinted genes, respectively. Dotted lines show the boundaries of the chromosomal rearrangement. Error bars represent the standard error of the mean (SEM). ∗∗p < 0.0001, p < 0.05. (C) Snrpn, Ube3a, and Gabrα5 mRNA expression in the adult mouse brain (top row) and hippocampus (other rows) detected by in situ hybridization. Scale bars represent 2 mm (top row) and 200 μm (other rows). (D) Methylation analysis by Southern blotting. Me, methylated; UnMe, unmethylated.
Figure 4
Figure 4
patDp/+ Mice Show Social Abnormalities (A–E) Three-chamber test. (A) Schematic representation of the three-chambered apparatus. The quadrant-like spaces between the full and dotted lines were used for quantitative analysis. (B) A stranger mouse was restricted in one of the side chambers in a wire cage, and only an empty wire cage was placed in the opposite chamber. Comparison of time spent in the quadrant spaces between “Stranger” and “Cage” for WT (n = 14) and patDp/+ mice (n = 13) is shown. Error bars represent the SEM. p < 0.05. (C) A novel object A (a dodecahedral pole) was placed in a cage in the chamber on one side, and no object in the chamber on the other side. Both WT and patDp/+ mice spent more time around the cage with a novel object. n = 11. ∗∗p < 0.001. (D) Another novel object B (a cone) was placed in a cage in the chamber on one side, and an adult conspecific mouse (C57BL/6J) that has had no previous contact with the subject (test mouse) in a cage in the chamber on the other side. WT mice spent more time around the stranger mouse. n = 11. p < 0.05. (E) A novel stranger mouse (C57BL/6J) is placed in a cage in the chamber on one side and a familiar mouse that was used in a previous test in D is placed in the chamber on the other side. n = 11. These data were evaluated by the t test. (F) Maternal separation-induced ultrasonic vocalizations at P5, P7, P14, and P21 (or P22). n = 32, 40, 40, and 16, respectively for patDp/+; n = 24, 39, 39, and 12, respectively for the WT. ∗∗p < 0.005. For (B)–(F) error bars represent the SEM.
Figure 5
Figure 5
patDp/+ Mice Show Behavioral Inflexibility in the Morris Water Maze and Barnes Maze Tests (A–F) Morris water maze test; n = 20 for both genotypes. White bar, WT; black bar, patDp/+. (A) The configuration of the four quadrants in the probe test after the original training (TA, target quadrant; OP, opposite quadrant; AR, adjacent right quadrant; AL, adjacent left quadrant). (B and C) Probe test after the original training. Upper panels indicate averaged swimming traces of the swim pattern for WT (B) and patDp/+ (C) mice. Warmer color represents more time spent. Lower panels show the quadrant occupancy for WT (B) and patDp/+ (C) mice. Both WT and patDp/+ mice showed significantly more time spent in the target quadrant compared with the other quadrants [WT, F(3,76) = 12.86, p < 0.0001; patDp/+, F(3,76) = 13.31, p < 0.0001; Newman-Keuls post hoc comparison (trained quadrant more than all the other quadrants); p < 0.01 for both genotypes]. (D) The configuration of the four quadrants in the reversal probe test. (E and F) Reversal probe test. Upper panels indicate averaged swimming traces of the swim pattern for WT (E) and patDp/+ (F) mice. Lower panels show the quadrant occupancy for WT (E) and patDp/+ (F) mice. While WT mice spent significantly more time in the reversed target quadrant, patDp/+ mice showed no significant difference in the time spent between the quadrants [WT, F(3,76) = 8.20, p < 0.0001; patDp/+, F(3,76) = 2.40, p = 0.0745; Neuman-Keuls post hoc comparison (trained quadrant more than all the other quadrants); WT, p < 0.01; patDp/+, p > 0.05]. (G–L) Barnes maze test, n = 22 for both genotypes. White bar, WT; black bar, patDp/+. (G) The target position in the Barnes maze original probe test. The hole at 0 degrees is the correct hole chosen as the target. (H and I) Both genotypes could learn the target position spatially in the original probe test [WT, F(11,252) = 25.47, p < 0.0001; patDp/+, F(11,252) = 32.27, p < 0.0001; Bonferroni post hoc comparison (time spent around the target position more than those of all the other holes), both genotypes, p < 0.01]. (J) The target position in the Barnes maze reversal probe test. The target at 0 degrees is moved to the opposite position. The original target position is labeled in red, at 180 degrees, and the new target position is labeled in blue, at 0 degrees. (K and L) While WT mice could learn the new target position flexibly, patDp/+ mice could not respond as flexibly as WT mice [WT, F(11,252) = 29,08, p < 0.0001; patDp/+, F(11,252) = 16.04, p < 0.0001; Bonferroni post hoc comparison (target versus 180 degrees), WT, p < 0.01; patDp/+, p > 0.05]. p < 0.01; n.s., not significant (p > 0.05). Furthermore, time spent around the 180 degree position and its neighboring 150 degree position was increased in patDp/+ mice compared to the WT (180 degrees, p < 0.1; 150 degrees, p < 0.05). For (B), (C), (E), (F), (H), (I), (K), and (L), error bars represent the SEM.
Figure 6
Figure 6
[Ca2+]i Response by a 5-HT2cR Agonist in Neurons (A) Northern blot analysis of MBII52. Quantitative data are shown in the right panel, where MBII52 expression in WT is defined as 1. (B–D) The effect of WAY 161503 on [Ca2+]i in primary cultured neurons. Representative images (responding cells are indicated by an arrowhead) and average responses under various concentrations of agonist are shown in (B) and (C), respectively. Averaged data for the concentration-dependent effect of WAY 161503 are indicated in (D). Error bars represent the SEM. n = 17 for patDp/+, n = 15 for matDp/+, n = 18 for WT. ∗∗p < 0.001.

References

    1. Abrahams B.S., Geschwind D.H. Advances in autism genetics: on the threshold of a new neurobiology. Nat. Rev. Genet. 2008;9:341–355. - PMC - PubMed
    1. Akashi M., Takumi T. The orphan nuclear receptor RORalpha regulates circadian transcription of the mammalian core-clock Bmal1. Nat. Struct. Mol. Biol. 2005;12:441–448. - PubMed
    1. Beaudet A.L. Autism: highly heritable but not inherited. Nat. Med. 2007;13:534–536. - PubMed
    1. Belmonte M.K., Cook E.H., Jr., Anderson G.M., Rubenstein J.L., Greenough W.T., Beckel-Mitchener A., Courchesne E., Boulanger L.M., Powell S.B., Levitt P.R. Autism as a disorder of neural information processing: directions for research and targets for therapy. Mol. Psychiatry. 2004;9:646–663. - PubMed
    1. Bolton P.F., Veltman M.W., Weisblatt E., Holmes J.R., Thomas N.S., Youings S.A., Thompson R.J., Roberts S.E., Dennis N.R., Browne C.E. Chromosome 15q11-13 abnormalities and other medical conditions in individuals with autism spectrum disorders. Psychiatr. Genet. 2004;14:131–137. - PubMed

Publication types

Substances

LinkOut - more resources