. 2009 Jun 26;137(7):1343-55.
doi: 10.1016/j.cell.2009.05.014.

Cytokine/Jak/Stat signaling mediates regeneration and homeostasis in the Drosophila midgut

Affiliations

Cytokine/Jak/Stat signaling mediates regeneration and homeostasis in the Drosophila midgut

Huaqi Jiang et al. Cell. .

Abstract

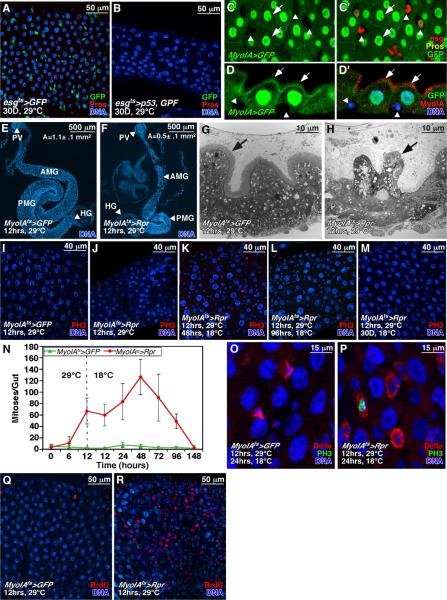
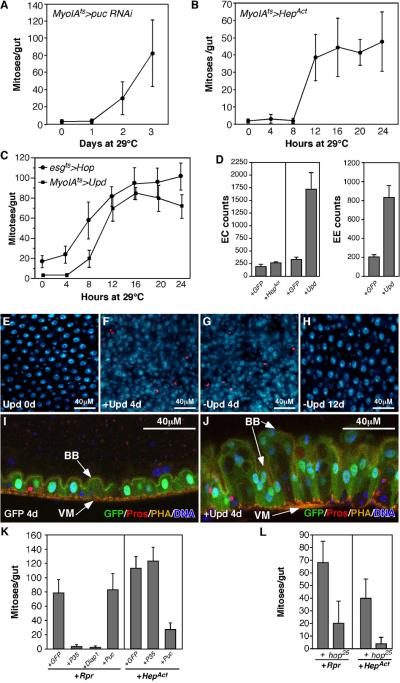
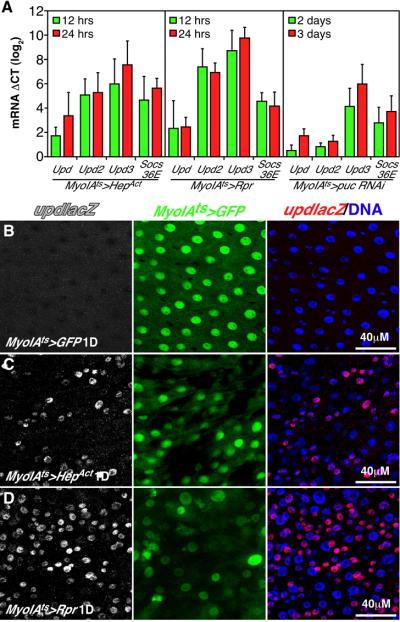
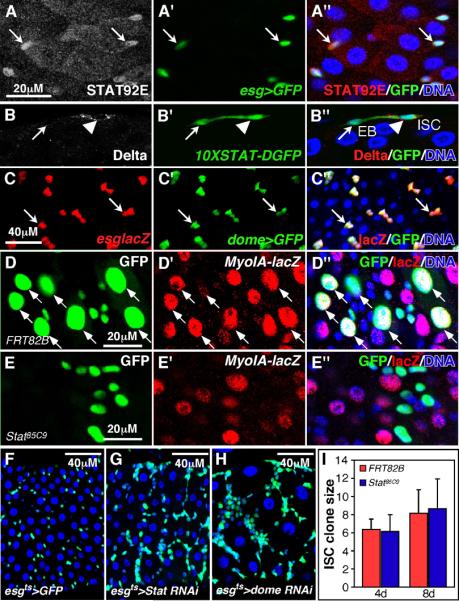
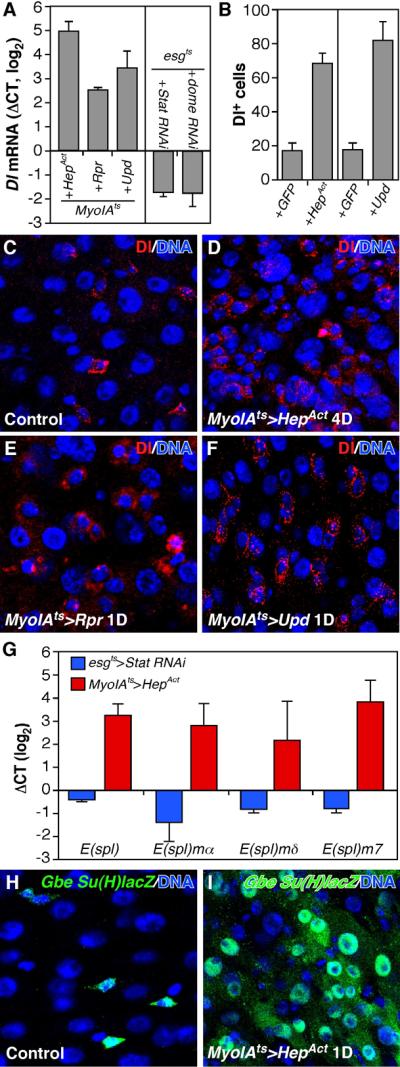
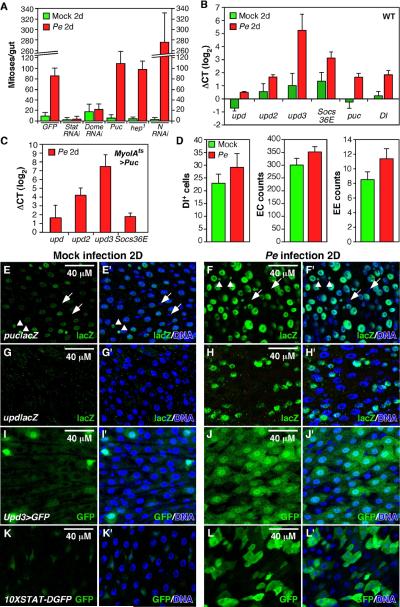
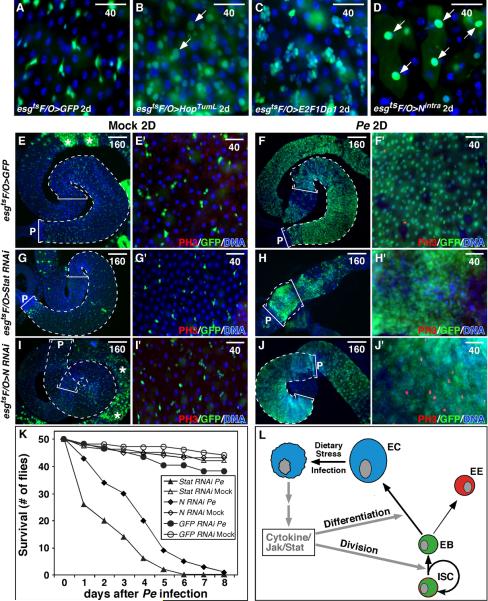
Cells in intestinal epithelia turn over rapidly due to damage from digestion and toxins produced by the enteric microbiota. Gut homeostasis is maintained by intestinal stem cells (ISCs) that divide to replenish the intestinal epithelium, but little is known about how ISC division and differentiation are coordinated with epithelial cell loss. We show here that when enterocytes (ECs) in the Drosophila midgut are subjected to apoptosis, enteric infection, or JNK-mediated stress signaling, they produce cytokines (Upd, Upd2, and Upd3) that activate Jak/Stat signaling in ISCs, promoting their rapid division. Upd/Jak/Stat activity also promotes progenitor cell differentiation, in part by stimulating Delta/Notch signaling, and is required for differentiation in both normal and regenerating midguts. Hence, cytokine-mediated feedback enables stem cells to replace spent progeny as they are lost, thereby establishing gut homeostasis.


Figures

Figure 1
Figure 1. Midgut cell ablation and renewal
(A, B) Drosophila p53 expressed with esgGal4ts for 30 days ablated esg+ progenitor cells (green), pros+ EEs (red), and decreased ECs (blue; B). Controls overexpressed GFP alone (A). (C-D’) MyoIAGal4-driven UAS-GFP is expressed in ECs (arrows) but not in small basally located esglacZ+ progenitors (red) or pros+ EEs (yellow; arrowheads). GFP+ ECs were positive for brush border Myosin IA (MyoIA is red in D’). (E, F) Expression of Reaper (Rpr) with MyoIAts for 12h reduced midgut size (F). Control shown in (E). PV: proventriculus; AMG: anterior midgut; PMG: posterior midgut; HG: hindgut. Mean surface area (A) for 10 such midguts is indicated. (G, H) TEM of midguts expressing Rpr (H) or GFP control (G). Rpr caused loss of brush border (arrows) and enterocyte. (I, J) Expression of Rpr with MyoIAts for 12 hours ablated enterocytes and promoted mitoses (PH3+, red). Control in (I). (K-N) Mitoses and midgut regeneration after enterocyte ablation. During recovery at 18°C, PH3+ mitotic cells (red) increased through 48-72h, but decreased as midguts regained their normal size by 96h. Midguts re-grew to their normal size, due partly to increases in enterocyte size (L). After 1 month cell density and EC size returned to normal (M). (O, P) Mitotic cells (PH3+, green) in regenerating midguts were positive for the ISC marker, Delta (red, P). ISCs in regenerating midguts (P) were larger than in controls (O), and had more Delta. (Q, R) EC ablation by Rpr increased BrdU incorporation (red) in small progenitors and large ECs. Blue in all panels is DNA.
Figure 2
Figure 2. JNK and Cytokine/Jak/Stat signaling induce ISC mitosis
(A, B) ISC mitoses, quantified by PH3+ mitotic figures/midgut. JNK activation in ECs was achieved by depleting puckered (puc) with RNAi (A), or expressing activated Hemipterous (HepAct, B) using the MyoIAts system. (C) Expression of Upd using MyoIAts, or Hopscotch (Jak) using esgts induced ISC mitosis. (D) Quantification of gut hyperplasia (ECs and EEs) induced by JNK (MyoIAts>HepAct 4 days, +HepAct) or Upd (MyoIAts>Upd 4 days, +Upd). pros+ cells were scored as EEs. Large polyploid Pros- Dl- cells were scored as ECs. (E-H) Upd-induced midgut hyperplasia and recovery. Upd induction in ECs increased PH3+ mitotic figures (red) and midgut cell density (blue: DNA). Midguts recovered normal morphology within 12 days of silencing ectopic Upd by temperature shift (H). (I, J) Sagittal view of the midgut hyperplasia induced by Upd. Upd induction using MyoIAts increased ECs in the epithelium (J). One side of the midgut epithelium is shown. Actin is stained with phalloidin (PHA, yellow, marks the visceral muscle and brush border), EEs are marked by Pros (red). ECs are marked by GFP (green). DNA is in blue. BB, brush border; VM, visceral muscle. (K) Epistasis of Rpr- and JNK-induced mitoses. Midgut mitotic indices 24h after transgene activation. Rpr-induced proliferation was suppressed by co-expressed P35 or DIAP1, but not by co-expressed Puc. Hep-induced proliferation was suppressed by Puc but not P35. (L) Epistasis showing that Rpr and JNK-induced proliferation require hop (Jak). Midgut mitotic figures were quantified after expressing either Rpr or HepAct for 12h in ECs in hop25 mutants or controls (+).
Figure 3
Figure 3. Apoptosis and JNK activation trigger cytokine production
(A) RT-qPCR of whole midgut cDNA after activating EC apoptosis (MyoIAts>Rpr) or JNK signaling (MyoIAts>HepAct or puc RNAi). Upd, Upd2, Upd3, and Socs36E were induced within 12h of transgene activation. ΔCT is the difference in calculated normalized Ct (threshold cycle) values between experimental and 0h control samples (∼log2 scale). Error bars indicate std. deviations from 3 independent biological samples. (B-D) Expression of the upd reporter, UpdlacZ, in control midguts (B), and following expression of Rpr (C) or HepAct (D) 24h after transgene activation by MyoIAts. GFP marks Gal4-expressing ECs.
Figure 4
Figure 4. Cytokine/Jak/Stat signaling is required for EB differentiation
(A) Nuclear STAT92E in esg+ progenitor cells. (B)10XSTAT-DGFP is active in progenitor cells including Dl+ ISCs (arrowhead) and Dl- EBs (arrow). (C) domeGal4 drives UAS-GFP in esglacZ+ progenitor cells. (D, E) MARCM clones showing that Stat85C9 mutant cells fail to enlarge or express the EC differentiation marker MyoIAlacZ (red, E). A control clone (D) has many lacZ+ ECs (red, arrows). GFP-marked clones analyzed 8d post-induction. (F-H) Expression of Stat92E RNAi (G) or Dome RNAi (H) using the esgts system for 8 days resulted in progenitor cell accumulation and EC depletion. (I) Cell numbers in control and Stat85C9 mutant MARCM clones.
Figure 5
Figure 5. Rpr, JNK, and Upd signaling up-regulate Delta/Notch signaling
(A) Midgut Dl RNA expression measured by RT-qPCR. UAS-HepAct or UAS-Upd were induced for 24h, whereas UAS-Rpr was induced for 12 hours, in ECs using the MyoIAts system. UAS-Stat RNAi or UAS-Dome RNAi were induced in progenitor cells for 4d using the esgts system. The data were normalized to GFP only controls (MyoIAts>GFP or esgts>GFP respectively). (B) Quantification of Dl+ progenitor cells in midguts expressing GFP (control), HepAct or Upd using the MyoIAts system. (C-F) Delta protein (red) after induction of HepAct (D), Rpr (E), or Upd (F) in ECs. (G) Notch activity as measured by E(spl)-C RNAs using RT-qPCR. UAS-HepAct was induced for 24h with MyoIAts and UAS-Stat RNAi was induced for 4d using esgts. The data were normalized as in (A). (H, I) The Notch activity reporter, GbeSu(H)lacZ was observed in more gut epithelial cells after induction of HepAct in ECs. Since LacZ is stable its presence in ECs may be due to perdurance.
Figure 6
Figure 6. Pe ingestion induces ISC proliferation
(A) Stat92E, Dome, or Notch were depleted from progenitor cells by UAS-RNAi using esgts, 2d prior to Pe infection. hep1 is a hypomorphic JNKK allele. JNK signaling was also downregulated in ECs by expressing UAS-Puc using MyoIAts. Midguts were scored for PH3+ mitotic figures 2d after infection (green). “Mock” indicates control animals shifted to food without Pe. (B) Midgut mRNAs measured in WT by RT-qPCR, 2d after Pe infection (red) or in controls (green). The data were normalized to day 0 (before infection) samples. (C) Midgut mRNAs measured in MyoIAts>Puc animals by RT-qPCR, 2d after Pe infection. The data were normalized to mock infected controls. (D) Quantification of Delta+ ISCs, MyoIA>GFP+ ECs and pros+ EEs during gut regeneration induced by Pe. (E-L) Reporter expression in midguts 2 days after mock (E, G, I and K) or Pe (F, H, J and L) infection. (E, F) A low level of the JNK reporter, puclacZ, was observed in ECs and EEs (usually paired, arrowheads) in controls (E). Widespread puclacZ after Pe infection (F). puclacZ was not expressed in progenitor cells (arrows). (G, H) updlacZ was not expressed in controls (G), but was induced in progenitor cells or pre-ECs after Pe infection (H). (I, J) upd3Gal4-driven GFP in controls (I), or after Pe infection (J). (K, L) The Stat reporter, 10XSTAT-DGFP, was normally confined to progenitor cells (K), but was present in many cells after Pe infection (L). Blue: DNA in all panels.
Figure 7
Figure 7. Midgut renewal after Pe infection
Midgut turnover in 3-10d old adult males, measured using the esgtsF/O system. (A) Gut turnover in a control after 2d. Progenitor cells and their newborn progeny are marked with GFP. (B) UAS-HopTumL expressed with the esgtsF/O system in progenitor cells for 2 days. These midguts contained many GFP+ cells, including large newborn ECs (arrows). (C) E2F expressed with the esgtsF/O system caused progenitor cell accumulation, but not EC hyperplasia. (D) Activated Notch (Nintra) promoted the rapid differentiation of progenitor cells into ECs (arrows), depleting the midgut of progenitors. (E-J) Males of the indicated genotypes were shifted to 29°C for 2d, fed Pe for 2d, and treated with antibiotics for 2d. “Mock” infected controls received no Pe, but were aged identically and received antibiotics. Brackets and dotted lines indicate the posterior midgut. P indicates the posterior end. Asterisks (E, I) indicate induction-independent GFP in the anterior midgut. Midguts were stained for PH3 (red). Pe infection caused almost complete midgut renewal (F), whereas few new ECs were generated in controls (E). Pe-induced cell turnover was inhibited by Stat92E RNAi expressed under esgtsF/O control (G, H). These midguts (H) were shrunken by EC depletion and condensation of the remaining non-mitotic progenitor cells (H’). When Notch RNAi was expressed, Pe infection resulted in midguts comprised mostly of small non-differentiating, proliferative progenitor cells (J, J’). (K) Survival after Pe infection. 50 flies (25 males, 25 females) were scored for survival after 2d of Pe infection (day 0) followed by another 2d of antibiotic treatment. Flies were then transferred to normal food. Controls (Mock or GFP RNAi with Pe infection) survived after antibiotic treatment, but flies depleted of N or Stat92E died rapidly. (L) Model for midgut homeostasis.

Comment in

References

    1. Adachi-Yamada T, Nakamura M, Irie K, Tomoyasu Y, Sano Y, Mori E, Goto S, Ueno N, Nishida Y, Matsumoto K. p38 mitogen-activated protein kinase can be involved in transforming growth factor beta superfamily signal transduction in Drosophila wing morphogenesis. Mol Cell Biol. 1999;19:2322–2329. - PMC - PubMed
    1. Agaisse H, Petersen UM, Boutros M, Mathey-Prevot B, Perrimon N. Signaling role of hemocytes in Drosophila JAK/STAT-dependent response to septic injury. Dev Cell. 2003;5:441–450. - PubMed
    1. Amcheslavsky A, Jiang J, Ip YT. Tissue damage-induced intestinal stem cell division in Drosophila. Cell Stem Cell. 2009;4:49–61. - PMC - PubMed
    1. Bach EA, Ekas LA, Ayala-Camargo A, Flaherty MS, Lee H, Perrimon N, Baeg GH. GFP reporters detect the activation of the Drosophila JAK/STAT pathway in vivo. Gene Expr Patterns. 2007;7:323–331. - PubMed
    1. Becker C, Fantini MC, Wirtz S, Nikolaev A, Lehr HA, Galle PR, Rose-John S, Neurath MF. IL-6 signaling promotes tumor growth in colorectal cancer. Cell Cycle. 2005;4:217–220. - PubMed

Publication types

MeSH terms