

Are Americans feeling less healthy? The puzzle of trends in self-rated health
- PMID: 19564169
- PMCID: PMC2714952
- DOI: 10.1093/aje/kwp144
Are Americans feeling less healthy? The puzzle of trends in self-rated health
Abstract
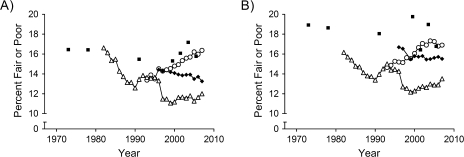
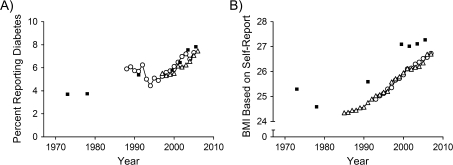
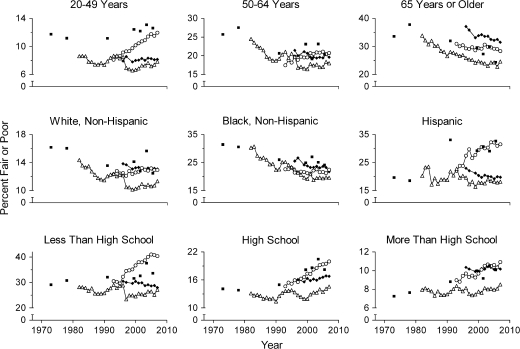
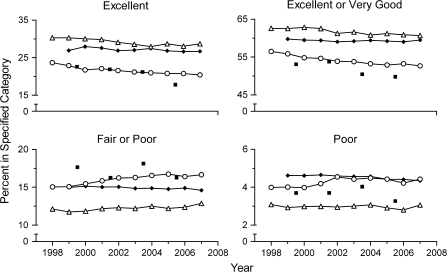
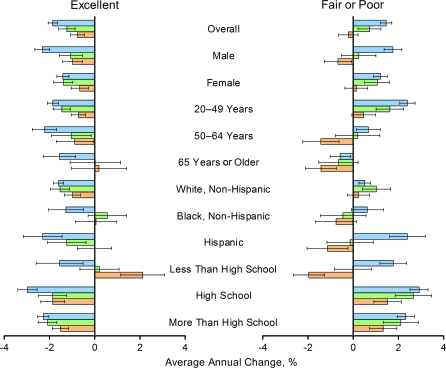
Although self-rated health is proposed for use in public health monitoring, previous reports on US levels and trends in self-rated health have shown ambiguous results. This study presents a comprehensive comparative analysis of responses to a common self-rated health question in 4 national surveys from 1971 to 2007: the National Health and Nutrition Examination Survey, Behavioral Risk Factor Surveillance System, National Health Interview Survey, and Current Population Survey. In addition to variation in the levels of self-rated health across surveys, striking discrepancies in time trends were observed. Whereas data from the Behavioral Risk Factor Surveillance System demonstrate that Americans were increasingly likely to report "fair" or "poor" health over the last decade, those from the Current Population Survey indicate the opposite trend. Subgroup analyses revealed that the greatest inconsistencies were among young respondents, Hispanics, and those without a high school education. Trends in "fair" or "poor" ratings were more inconsistent than trends in "excellent" ratings. The observed discrepancies elude simple explanations but suggest that self-rated health may be unsuitable for monitoring changes in population health over time. Analyses of socioeconomic disparities that use self-rated health may be particularly vulnerable to comparability problems, as inconsistencies are most pronounced among the lowest education group. More work is urgently needed on robust and comparable approaches to tracking population health.
Figures
Comment in
-
Re: "Are Americans feeling less healthy? The puzzle of trends in self-rated health".Am J Epidemiol. 2009 Dec 15;170(12):1581-2; author reply 1582-3. doi: 10.1093/aje/kwp367. Epub 2009 Nov 1. Am J Epidemiol. 2009. PMID: 19884128 No abstract available.
References
-
- Wilson IB, Cleary PD. Linking clinical variables with health-related quality of life. A conceptual model of patient outcomes. JAMA. 1995;273(1):59–65. - PubMed
-
- Revicki DA. Regulatory Issues and Patient-reported Outcomes Task Force for the International Society for Quality of Life Research. FDA draft guidance and health-outcomes research. Lancet. 2007;369(9561):540–542. - PubMed
-
- US Department of Health and Human Services. Healthy People 2010. Washington, DC: US Department of Health and Human Services; 2000.
-
- Kramers PG. The ECHI project: health indicators for the European Community. Eur J Public Health. 2003;13(3 suppl):101–106. - PubMed
-
- Reeve BB, Burke LB, Chiang YP, et al. Enhancing measurement in health outcomes research supported by agencies within the US Department of Health and Human Services. Qual Life Res. 2007;16(suppl 1):175–186. - PubMed
