. 2009 Aug 28;284(35):23444-53.
doi: 10.1074/jbc.M109.000778. Epub 2009 Jun 29.

Phosphorylation-independent regulation of metabotropic glutamate receptor 5 desensitization and internalization by G protein-coupled receptor kinase 2 in neurons

Affiliations

Phosphorylation-independent regulation of metabotropic glutamate receptor 5 desensitization and internalization by G protein-coupled receptor kinase 2 in neurons

Fabiola M Ribeiro et al. J Biol Chem. .

Abstract

The uncoupling of metabotropic glutamate receptors (mGluRs) from heterotrimeric G proteins represents an essential feedback mechanism that protects neurons against receptor overstimulation that may ultimately result in damage. The desensitization of mGluR signaling is mediated by both second messenger-dependent protein kinases and G protein-coupled receptor kinases (GRKs). Unlike mGluR1, the attenuation of mGluR5 signaling in HEK 293 cells is reported to be mediated by a phosphorylation-dependent mechanism. However, the mechanisms regulating mGluR5 signaling and endocytosis in neurons have not been investigated. Here we show that a 2-fold overexpression of GRK2 leads to the attenuation of endogenous mGluR5-mediated inositol phosphate (InsP) formation in striatal neurons and siRNA knockdown of GRK2 expression leads to enhanced mGluR5-mediated InsP formation. Expression of a catalytically inactive GRK2-K220R mutant also effectively attenuates mGluR5 signaling, but the expression of a GRK2-D110A mutant devoid in Galpha(q/11) binding increases mGluR5 signaling in response to agonist stimulation. Taken together, these results indicate that the attenuation of mGluR5 responses in striatal neurons is phosphorylation-independent. In addition, we find that mGluR5 does not internalize in response to agonist treatment in striatal neuron, but is efficiently internalized in cortical neurons that have higher levels of endogenous GRK2 protein expression. When overexpressed in striatal neurons, GRK2 promotes agonist-stimulated mGluR5 internalization. Moreover, GRK2-mediated promotion of mGluR5 endocytosis does not require GRK2 catalytic activity. Thus, we provide evidence that GRK2 mediates phosphorylation-independent mGluR5 desensitization and internalization in neurons.


Figures

FIGURE 1.
FIGURE 1.
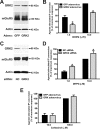
Striatal neurons as a model for mGluR5 signaling studies. A, shown are representative immunoblots for mGluR5, mGluR1, GRK2, and actin protein expression in either striatal (Str) or cortical (Ctx) neuronal cultures. 50 μg of cell lysate were used for each sample. B, shown is a representative immunoblot for mGluR5 protein expression in either striatal (Str) or cerebellum (Cer) from either wild-type or mGluR5−/− mice. 50 μg of cell lysate were used for each sample. C, shown is DHPG-stimulated inositol phosphate formation in striatal neurons stimulated with increasing concentrations of agonist for 5 min at 37 °C. The data points represent the means ± S.E. of five independent experiments, normalized to the maximum DHPG-stimulated response. D, shown is DHPG-stimulated inositol phosphate formation in response to 10 μm agonist for 5 min at 37 °C, either in the presence or absence of mGluR1- (LY36785) or mGluR5-antagonists (MPEP). Data represent the means ± S.E. of four independent experiments. The asterisk indicates a significant difference compared with control (p < 0.05).
FIGURE 2.
FIGURE 2.
GRK2 desensitizes mGluR5 in neurons. Shown are representative laser-scanning confocal micrographs demonstrating the presence of both Alexa Fluor 555-conjugated anti-NeuN antibody (A) and Alexa Fluor 488-conjugated anti-FLAG antibody-labeled FLAG-GRK2 (B) in the same striatal neurons (C). Data are representative images of multiple cells from three independent experiments. Bar, 10 μm.
FIGURE 3.
FIGURE 3.
A, shown are representative immunoblots for mGluR5, GRK2, and actin protein expression in neurons infected with either GFP or GRK2 adenovirus. 50 μg of cell lysate were used for each sample. B, shown is mGluR5-stimulated inositol phosphate formation in response to either 1 or 10 μm DHPG for 5 min at 37 °C in striatal neurons infected with either GFP or GRK2 adenovirus. Data represent the means ± S.E. of four independent experiments, normalized to DHPG-stimulated GFP-infected neurons maximum response. Asterisks indicate significant differences compared with GFP adenovirus infected neurons at the corresponding agonist concentration (p < 0.05). C, shown are representative immunoblots for mGluR5, GRK2, and actin protein expression in neurons transfected with either NC or GRK2 siRNA. 50 μg of cell lysate were used for each sample. D, shown is mGluR5-stimulated inositol phosphate formation in response to either 1 or 10 μm DHPG for 5 min at 37 °C in striatal neurons transfected with either NC or GRK2 siRNA. Data represent the means ± S.E. of five independent experiments, normalized to DHPG-stimulated NC siRNA-transfected neurons maximum response. Asterisks indicate significant differences compared with NC siRNA transfected neurons at the corresponding agonist concentration (p < 0.05). E, shown is mGluR5-stimulated inositol phosphate formation in response to either 10 or 100 μm carbachol for 5 min at 37 °C in striatal neurons infected with either GFP or GRK2 adenovirus. Data represent the means ± S.E. of four independent experiments, normalized to carbachol-stimulated GFP-infected neurons maximum response.
FIGURE 4.
FIGURE 4.
DHPG-induced mGluR5 phosphorylation in striatal neurons. A, shown is a representative autoradiograph demonstrating mGluR5 phosphorylation in striatal neurons infected with either GFP or GRK2 adenovirus and stimulated with 10 μm DHPG for 0, 5, or 10 min. B, graph shows the densitometric analysis of mGluR5 phosphorylation autoradiograms. Data represent the means ± S.E. of seven independent experiments, normalized to mGluR5 phosphorylation in GFP-infected neurons not treated with agonist.
FIGURE 5.
FIGURE 5.
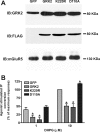
GRK2-mediated mGluR5 desensitization in striatal neurons. A, shown are representative immunoblots for mGluR5 and GRK2 protein expression in neurons infected with GFP, GRK2, GRK2-K220R, or GRK2-D110A adenovirus. 50 μg of cell lysate were used for each sample, and the samples were immunoblotted for the expression of GRK2, FLAG, and mGluR5 protein using anti-GRK2, anti-FLAG, and anti-mGluR5 antibodies. B, shown is mGluR5-stimulated inositol phosphate formation in response to either 1 or 10 μm DHPG for 5 min at 37 °C in striatal neurons infected with GFP, GRK2, GRK2-K220R, or GRK2-D110A adenovirus. Data represent the means ± S.E. of five independent experiments, normalized to DHPG-stimulated GFP-infected neurons maximum response. Asterisks indicate significant differences compared with GFP adenovirus-infected neurons at the corresponding agonist concentration (p < 0.05).
FIGURE 6.
FIGURE 6.
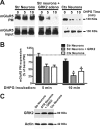
GRK2-mediated mGluR5 internalization in striatal neurons. A, shown is a representative immunoblot for cell surface biotin-labeled mGluR5 (upper panel) in cortical (Ctx) and striatal (Str) neurons infected with either GFP or GRK2 adenovirus and stimulated with 10 μm DHPG for 0, 5, or 10 min. Total cell lysates (50 μg) are used to determine mGluR5 total cell expression (input) for each sample (lower panel). B, graph shows the densitometric analysis of biotin-labeled cell surface mGluR5 immunoblot. Data represent the mean ± S.E. of four independent experiments, normalized to cell surface mGluR5 in neurons not treated with agonist. Asterisks indicate significant difference as compared with mGluR5 cell surface expression in striatal neurons expressing endogenous levels of GRK2 (p < 0.05). C, shown are representative immunoblots for GRK2 and actin protein expression in cortical and striatal neurons infected with either GFP or GRK2 adenovirus. 50 μg of cell lysate were used for each sample.
FIGURE 7.
FIGURE 7.
GRK2 does not affect recycling or basal plasma membrane expression of mGluR5. A, shown is a representative immunoblot for cell surface biotin-labeled mGluR5 (upper panel) in striatal neurons infected with either GFP or GRK2 adenovirus and stimulated with 10 μm DHPG for 10 min and allowed to recover for 10 or 30 min. Total cell lysates (50 μg) were used to determine mGluR5 total cell expression (input) for each sample (lower panel). B, graph shows the densitometric analysis of biotin-labeled cell surface mGluR5 immunoblot. Data represent the mean ± S.E. of four independent experiments, normalized to cell surface mGluR5 in neurons not treated with agonist. Asterisk indicates significant difference as compared with mGluR5 cell surface expression in striatal neurons expressing endogenous levels of GRK2 (p < 0.05). C, graph shows the densitometric analysis of biotin-labeled cell surface mGluR5 immunoblot from unstimulated neurons. Data represent the mean ± S.E. of five independent experiments, normalized to total mGluR5 expression for each sample and expressed as percentage of cell surface mGluR5 in neurons infected with GFP adenovirus.
FIGURE 8.
FIGURE 8.
GRK2 mutants promote mGluR5 internalization. A, shown is a representative immunoblot for cell surface biotin-labeled mGluR5 (upper panel) in striatal neurons infected with GFP, GRK2, GRK2-K220R, or GRK2-D110A adenovirus and stimulated with 10 μm DHPG for 0, 5, or 10 min. Total cell lysates (50 μg) were used to determine mGluR5 total cell expression (input) for each sample (lower panel). B, graph shows the densitometric analysis of biotin-labeled cell surface mGluR5 immunoblot. Data represent the mean ± S.E. of five independent experiments, normalized to cell surface mGluR5 in neurons not treated with agonist. Asterisks indicate significant differences as compared with untreated matched controls (p < 0.05).
FIGURE 9.
FIGURE 9.
GRK2 overexpression leads to an increase in clathrin recruitment to mGluR5. A, shown is a representative immunoblot for the co-immunoprecipitation of clathrin with mGluR5 in striatal neurons infected with either GFP or GRK2 adenovirus and stimulated with 10 μm DHPG for 5 min (right panel). mGluR5 immunoprecipitation (IP) was performed by using either anti-mGluR5 or anti-HA (negative control) antibodies from an equivalent amount of protein (500–1000 μg of protein). Total cell lysates (30 μg) were used to determine clathrin, mGluR5, and GRK2 total cell expression (input) for each sample (left panel). B, graph shows the densitometric analysis of immunoblots for clathrin that was co-immunoprecipitated with mGluR5. Data represent the mean ± S.E. of three independent experiments, normalized to clathrin co-immunoprecipitated in GFP-infected neurons. The asterisk indicates a significant difference as compared with GFP-infected neurons (p < 0.05).

References

    1. Dingledine R., Borges K., Bowie D., Traynelis S. F. (1999) Pharmacol. Rev. 51,7–61 - PubMed
    1. Nakanishi S., Masu M. (1994) Annu. Rev. Biophys. Biomol. Struct. 23,319–348 - PubMed
    1. Wang J. Q., Fibuch E. E., Mao L. (2007) J. Neurochem. 100,1–11 - PubMed
    1. Conn P. J., Pin J. P. (1997) Annu. Rev. Pharmacol. Toxicol. 37,205–237 - PubMed
    1. Dhami G. K., Ferguson S. S. (2006) Pharmacol. Ther. 111,260–271 - PubMed

Publication types

Substances