. 2009 Jul 6;206(7):1603-14.
doi: 10.1084/jem.20090547. Epub 2009 Jun 29.

Regulation of TLR7/9 responses in plasmacytoid dendritic cells by BST2 and ILT7 receptor interaction

Affiliations

Regulation of TLR7/9 responses in plasmacytoid dendritic cells by BST2 and ILT7 receptor interaction

Wei Cao et al. J Exp Med. .

Abstract

Plasmacytoid dendritic cells (pDCs) produce copious type I interferon (IFN) upon sensing nucleic acids through Toll-like receptor (TLR) 7 and TLR9. Uncontrolled pDC activation and IFN production are implicated in lymphopenia and autoimmune diseases; therefore, a mechanism controlling pDC IFN production is essential. Human pDCs specifically express an orphan receptor, immunoglobulin-like transcript 7 (ILT7). Here, we discovered an ILT7 ligand expressed by human cell lines and identified it as bone marrow stromal cell antigen 2 (BST2; CD317). BST2 directly binds to purified ILT7 protein, initiates signaling via the ILT7-FcepsilonRIgamma complex, and strongly inhibits production of IFN and proinflammatory cytokines by pDCs. Readily induced by IFN and other proinflammatory cytokines, BST2 may modulate the human pDC's IFN responses through ILT7 in a negative feedback fashion.


Figures

Figure 1.
Figure 1.
Human tumor cell lines express a potential ligand for ILT7. (A) Five human breast cancer cell lines were co-cultured with either ILT7+ NFAT-GFP reporter cells or parental NFAT-GFP reporter cells. The percentages of GFP-positive reporter cells were analyzed. Data are representative of four independent experiments. (B) Human carcinoma cells were co-cultured with ILT7+ NFAT-GFP reporter cells. The percentages of GFP-positive reporter cells were analyzed. The categories of the cancer lines are as follows: OVCAR-3, SKOV-3, and DOV-13 (ovarian); HT-29 and HCT-116 (colon); WM35, WM239, MEL526, MEL624, MEL888, and MEL938 (melanoma); U87, LN229, and SNB19 (glioblastoma); A549 (lung cancer). Data are representative of two independent experiments. (C) T47D cells were co-cultured with ILT7+ NFAT-GFP reporter cells in the presence of 1 µg/ml of control IgG1 or anti-ILT7 mAb. The percentages of GFP-positive reporter cells were plotted. Data are representative of four independent experiments. (D) Breast cancer MDA-MB-468 cells were first cultured for 5 d in the presence of medium, 5 ng/ml of TNF-α or 500 U/ml of IFN-α, and then co-cultured with NFAT-GFP reporter cells. The percentages of GFP-positive reporter cells were analyzed. Data are representative of four independent experiments. Error bars represent the mean ± the SEM.
Figure 2.
Figure 2.
Characterization of mAbs against a putative ILT7 ligand. (A) Culture supernatants from different hybridoma clones were included in the co-cultures of ILT7 reporter cells and T47D cells. The percentages of GFP-positive reporter cells were determined. Two clones able to inhibit GFP induction are indicated (arrows). Anti-ILT7 mAb (clone 17.2) was included as a positive control. (B) Five human breast cancer cells were stained with mAb 26F8 (red line) or an isotype-matched control mAb (shaded area) and analyzed by flow cytometry. A similar result obtained with mAb 28G4 is not shown. Data are representative of three independent experiments. (C) T47D cells were co-cultured with ILT7 reporter cells in the presence of control IgG1, 26F8, or 28G4 mAbs at different concentrations. The percentages of GFP-positive reporter cells were plotted. Data are representative of four independent experiments. (D) Surface biotinylated MDA-MB-231 and T47D were immunoprecipitated with control IgG1, 26F8, or 28G4. The precipitated proteins were analyzed by Western blotting with NeutrAvidin-HRP. Arrows indicate the specific protein bands obtained from T47D cells. Data are representative of two independent experiments.
Figure 3.
Figure 3.
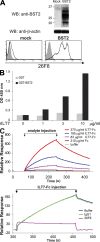
BST2 directly binds to ILT7. (A) HEK293 cells transiently transfected with mock control or BST2 cDNA were analyzed by Western blotting for BST2 protein expression. Transfected cells were stained with 26F8 mAb and analyzed by flow cytometry. The staining profile with IgG isotype-matched control mAb is shown in the shaded area. Staining with 28G4 mAb produced identical results (not depicted). Data are representative of five independent experiments. (B) Plate-coated GST or BST2-GST were incubated with different concentrations of recombinant ILT7-Fc and HRP-conjugated anti–human Fc. Shown is absorption at OD 450 nm for each sample after addition of Tetramethyl benzidine (TMB) substrate. Data are representative of three independent experiments. (C, top) Recombinant BST2-Fc, precoated on the surface of Biacore sensor chips, was mixed with different concentrations of injected recombinant ILT7-Fc. The kinetic response data after subtracting the value from precoated Fc are shown. Also shown are control responses with Fc alone or buffer. (bottom) Precoated recombinant BST2-Fc was premixed with buffer, control IgG1, or anti-BST2 mAb 26F8 and then exposed to injected recombinant ILT7-Fc. The kinetic response data after subtracting the value from precoated Fc are shown. Data are representative of two independent experiments.
Figure 4.
Figure 4.
BST2 binds and potently activates ILT7. (A) GST or BST2-GST protein was co-cultured with ILT7+ NFAT-GFP reporter cells. The percentages of GFP-positive reporter cells are shown. Neutralizing antibodies αILT7 (5 µg/ml) or 26F8 (25 µg/ml) or an IgG1 control antibody were included in the cultures, as indicated. Data are representative of four independent experiments. (B) HEK293 cells transiently transfected with mock control or BST2 cDNA were co-cultured with ILT7+ NFAT-GFP reporter cells. The percentages of GFP+ reporter cells are shown. Neutralizing antibodies αILT7 (5 µg/ml), 26F8 (25 µg/ml), 28G4 (25 µg/ml), or control IgG1 were included in the cultures, as indicated. Data are representative of three independent experiments.
Figure 5.
Figure 5.
BST2 activates primary pDCs and inhibits IFN and cytokine production by pDCs. (A) pDCs were incubated with anti-ILT7, recombinant Fc, or BST2-Fc proteins and then analyzed for calcium influx. pDCs pretreated with 5 µM of Syk inhibitor were also analyzed. Data are representative of three independent experiments. (B) The amounts of secreted cytokines from pDCs cultured with plate-bound Fc or BST2-Fc are shown. pDCs were activated overnight with either 0.2 µM of CpG 2216 or MOI 6 of Flu. Data are representative of five independent experiments with ten donors. (C) The levels of gene transcripts from pDCs cultured with purified Fc or BST2-Fc are shown. The relative expression of each gene was normalized with S18 and calculated against the value obtained from normal total PBMCs. Data are representative of two independent experiments. (D) BST2 does not affect co-stimulatory molecule expression by pDCs. pDCs cultured with plate-bound Fc or BST2-Fc and then activated with 0.2 µM of CpG 2216 for 48 h. Surface levels of CD80 and CD86 are shown. Data are representative of two independent experiments. (E) pDCs preincubated with medium, 20 µg/ml of IgG1 or 20 µg/ml of neutralizing ILT7 mAb were cultured overnight with plate-bound Fc or BST2-Fc in the presence of CpG 2216. The amounts of secreted IFN-α were measured by ELISA. Percent of BST2-mediated IFN-α suppression was calculated as percent ratio of IFN-α ([Fc minus BST2-Fc]/[Fc]) and plotted. Data are representative of two independent experiments with four donors. (F) The amounts of secreted IFN-α from Flu-challenged pDCs cultured with HEK293 with or without surface HA-tagged BST2 are shown. Data are representative of two independent experiments.
Figure 6.
Figure 6.
Analysis of BST2 expression and potential BST2–ILT7 cis-interaction. (A) HEK293, NHDF, HUVEC, and HaCat cells, cultured in the absence or presence of 500 units/ml of IFN-α for 48 h, were stained with anti-BST2 mAb 26F8. Staining with isotype-matched control Ig is shown in the gray shaded area. Data are representative of three independent experiments. (B) Fresh isolated pDCs from peripheral blood or cells activated with various stimuli for 48 h were analyzed for surface BST2 expression by flow cytometry. Data are representative of two independent experiments. (C) Human Burkitt’s lymphoma Namalwa cells transduced with different pDC receptor complexes, i.e., BDCA2/FcϵRIγ or ILT7/FcϵRIγ, were analyzed for surface BST2 and ILT7 expression. Data are representative of three independent experiments.
Figure 7.
Figure 7.
A proposed model of BST2–ILT7 mediated regulation of pDC innate immune responses. (top) By sensing viral infection, pDCs can rapidly and rigorously produce large amounts of IFN-I via TLR7 or TLR9 activation. IFN-I then may induce the neighboring cells to express BST2, which in turn engages with ILT7 on pDCs to down-regulate the magnitude of IFN and cytokine responses in a negative feedback manner. (bottom) In a tumor environment where BST2 is endogenously expressed, infiltrating pDCs may be functionally suppressed to elicit normal IFN response to TLR ligands as a result of BST2–ILT7 interaction.

Similar articles

Cited by

References

    1. Arase H., Mocarski E.S., Campbell A.E., Hill A.B., Lanier L.L. 2002. Direct recognition of cytomegalovirus by activating and inhibitory NK cell receptors.Science. 296:1323–1326 - PubMed
    1. Bauer S., Groh V., Wu J., Steinle A., Phillips J.H., Lanier L.L., Spies T. 1999. Activation of NK cells and T cells by NKG2D, a receptor for stress-inducible MICA.Science. 285:727–729 - PubMed
    1. Benitez-Ribas D., Adema G.J., Winkels G., Klasen I.S., Punt C.J.A., Figdor C.G., de Vries I.J.M. 2006. Plasmacytoid dendritic cells of melanoma patients present exogenous proteins to CD4+ T cells after FcγRII-mediated uptake.J. Exp. Med. 203:1629–1635 - PMC - PubMed
    1. Blanco P., Palucka A.K., Gill M., Pascual V., Banchereau J. 2001. Induction of dendritic cell differentiation by IFN-alpha in systemic lupus erythematosus.Science. 294:1540–1543 - PubMed
    1. Blasius A.L., Cella M., Maldonado J., Takai T., Colonna M. 2006a. Siglec-H is an IPC-specific receptor that modulates type I IFN secretion through DAP12.Blood. 107:2474–2476 - PMC - PubMed

Publication types

MeSH terms