. 2009 Jun 29;185(7):1275-84.
doi: 10.1083/jcb.200810002.

Demonstration of catch bonds between an integrin and its ligand

Affiliations

Demonstration of catch bonds between an integrin and its ligand

Fang Kong et al. J Cell Biol. .

Abstract

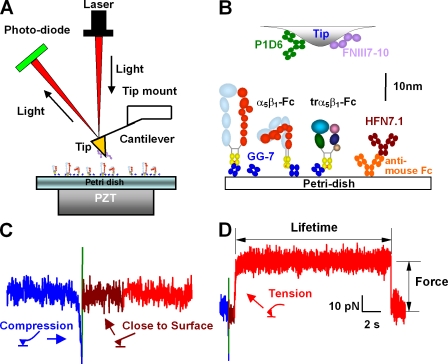
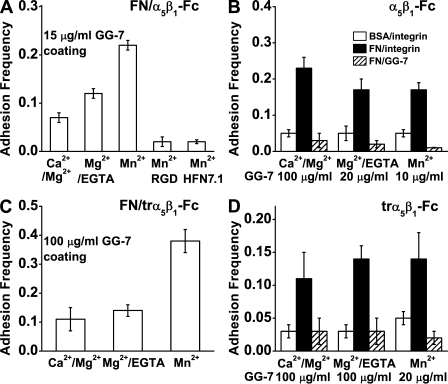
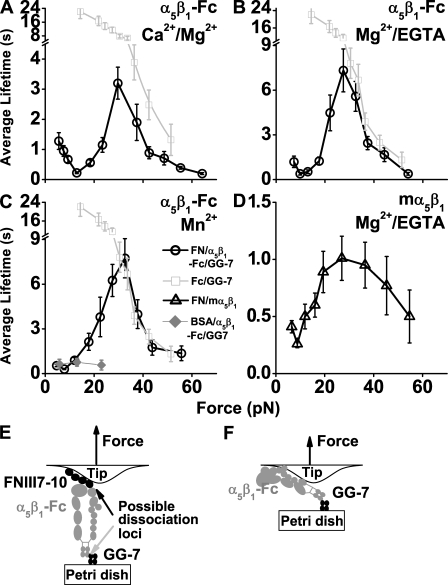
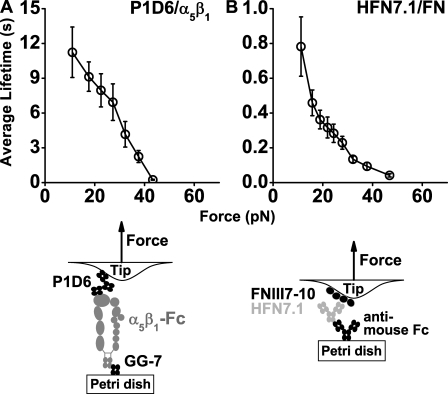
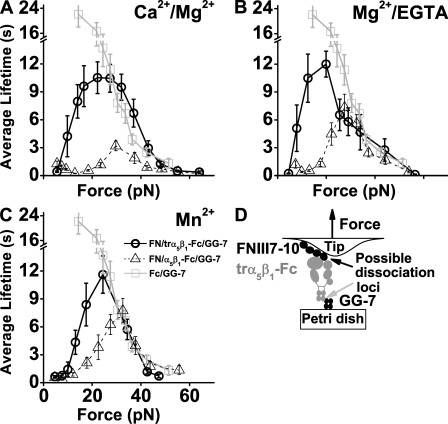
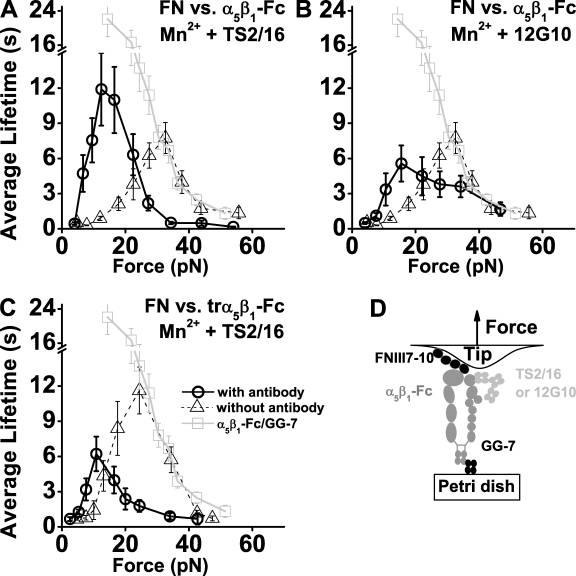
Binding of integrins to ligands provides anchorage and signals for the cell, making them prime candidates for mechanosensing molecules. How force regulates integrin-ligand dissociation is unclear. We used atomic force microscopy to measure the force-dependent lifetimes of single bonds between a fibronectin fragment and an integrin alpha(5)beta(1)-Fc fusion protein or membrane alpha(5)beta(1). Force prolonged bond lifetimes in the 10-30-pN range, a counterintuitive behavior called catch bonds. Changing cations from Ca(2+)/Mg(2+) to Mg(2+)/EGTA and to Mn(2+) caused longer lifetime in the same 10-30-pN catch bond region. A truncated alpha(5)beta(1) construct containing the headpiece but not the legs formed longer-lived catch bonds that were not affected by cation changes at forces <30 pN. Binding of monoclonal antibodies that induce the active conformation of the integrin headpiece shifted catch bonds to a lower force range. Thus, catch bond formation appears to involve force-assisted activation of the headpiece but not integrin extension.


Figures

Figure 1.
Figure 1.
AFM experiment. (A) AFM schematic (not to scale) is shown. A laser is focused on the back of cantilever end and bounced onto a photodiode to measure force on the tip that bends the cantilever. A Petri dish is mounted on a PZT with an integrated capacitive sensor to allow for distance control with subnanometer precision. (B) Functionalization of AFM. Molecules depicted represent a composite of several adsorbed or captured on the cantilever tip or the Petri dish. Extended and bent α5β1-Fc, depicted as heterodimers of an α (light blue) and a β (red) subunit fused to an Fc (yellow), and trα5β1-Fc, consisting of the β propeller (teal) and thigh (dark green) domains of the α subunit as well as the βA (pink), hybrid (dark blue), and plexin/semaphorin/integrin (tan) domains of the β subunit fused to an Fc, were captured by an anti-Fc mAb (GG-7) Fab (blue) preadsorbed on the Petri dish. In some experiments, these were replaced by an anti-FN mAb (HFN7.1; brown) captured by an anti–mouse Fc antibody (orange) preadsorbed on the Petri dish. FNIII7–10 (purple) was adsorbed on the cantilever tip. In some control experiments, FNIII7–10 was replaced by an anti-α5β1 mAb (P1D6; green). (C) Force-scan trace without adhesion. The Petri dish was moved up by the PZT to contact the cantilever tip (blue trace), immediately retracted to a small distance (green trace) from the tip to reduce nonspecific adhesion, held at this distance for 0.5 s to allow for bond formation (brown trace), and retracted away from the tip to detect adhesion (red trace). The trace illustrates a contact cycle without binding where the retraction curve returned to zero force upon Petri dish retraction. (D) Force-scan trace with adhesion. The color codes are the same as those in C, which illustrates a contact cycle with binding and lifetime measurement. Petri dish retraction resulted in a tensile force indicating binding. Once the pulling force reached a preset value (indicated), a feedback loop was triggered to keep the cantilever deflection at the set point. The lifetime at that force (indicated) was measured until bond failure, signified by the springing back of the cantilever to the level of zero mean force. The bending configurations of the cantilever are depicted with colors matching the corresponding colors of the traces in C and D.
Figure 2.
Figure 2.
Binding specificity. (A and B) α5β1-Fc data are shown. (C and D) trα5β1-Fc data are shown. Frequencies of adhesion between 10 µg/ml FNIII7–10 adsorbed on cantilever tips and 10 µg/ml α5β1-Fc (A) or trα5β1-Fc (C) captured by 15 or 100 µg/ml GG-7 Fab precoated on Petri dishes in buffer containing the indicated cations without or with cyclo(-GRGDSP) or HFN7.1 in solution were enumerated in 100 tests for each spot and presented as mean ± SEM of 3–5 spots. Frequencies (measured with the same protocol as in A and C) of adhesion between 10 µg/ml FNIII7–10 coated on cantilever tips and 10 µg/ml α5β1-Fc (B) or trα5β1-Fc (D) captured by GG-7 Fab preadsorbed on Petri dishes with indicated concentrations (closed bars) are compared with those between BSA-coated tips and trα5β1-Fc–functionalized Petri dishes (open bars) and with those between FNIII7–10-coated tips and GG-7–coated Petri dishes without incubating with trα5β1-Fc (hatched bars) in the indicated cation conditions.
Figure 3.
Figure 3.
Lifetimes of FN–α5β1 bonds. (A–C) Plots of lifetime versus force of α5β1-Fc–functionalized Petri dish dissociating from FNIII7–10-coated cantilever tips (circles) in Ca2+/Mg2+ (A), Mg2+/EGTA (B), and Mn2+ (C). (D) A qualitatively similar plot (triangles) of mα5β1 reconstituted into lipid bilayer dissociating from FNIII7–10-coated cantilever tips in Mg2+/EGTA confirmed the catch bond observation. Also plotted in A–C is the lifetime versus force curve of Fc dissociating from GG-7 (squares). For B and C, the black and gray curves overlap at forces >30 pN, indicating that measured lifetimes beyond 30 pN were caused by Fc–GG-7 dissociation instead of FNIII7–10–α5β1-Fc dissociation. Also shown in C is a lifetime versus force plot (diamonds) of α5β1-Fc–functionalized Petri dish dissociating from BSA-coated cantilever tips measured in Mn2+. (E) Schematic of the molecular arrangement indicating possible dissociation loci between FNIII7–10 and α5β1-Fc or between α5β1-Fc and GG-7. (F) Schematic of the molecular arrangement for experiments that measured the capturing strength of the Fc–GG-7 interaction. Error bars indicate mean ± SEM.
Figure 4.
Figure 4.
Lifetimes of antibody–antigen bonds. (A and B) Plots of lifetime (mean ± SEM) versus force of interactions between α5β1-Fc–functionalized Petri dish and P1D6-coated cantilever tips (A) and between HFN7.1 captured by anti–mouse Fc antibody preadsorbed on Petri dish and FNIII7–10-coated cantilever tips (B). Schematics depict the molecular arrangement for the experiments.
Figure 5.
Figure 5.
Lifetimes of FN–trα5β1 bonds. (A–C) Plots of lifetime (mean ± SEM) versus force of trα5β1-Fc–functionalized Petri dish dissociating from FNIII7–10-coated cantilever tips (circles) in Ca2+/Mg2+ (A), Mg2+/EGTA (B), and Mn2+ (C). Data from Fig. 3 (A–C) are replotted in A–C for comparison. The lifetime versus force curves of α5β1-Fc–functionalized Petri dish dissociating from FNIII7–10-coated cantilever tips are shown as triangles, and α5β1-Fc–coated cantilever tips dissociating from GG-7–functionalized Petri dish are shown as squares. (D) Schematic of the molecular arrangement indicating possible dissociation loci between FNIII7–10 and trα5β1-Fc or between trα5β1-Fc and GG-7.
Figure 6.
Figure 6.
Effects of activating mAbs. (A–C) Lifetime (mean ± SEM) versus force plots (circles) of α5β1-Fc–functionalized Petri dish dissociating from FNIII7–10-coated cantilever tips in Mn2+ and 10 µg/ml TS2/16 (A) or 12G10 (B) or trα5β1-Fc–functionalized Petri dish dissociating from FNIII7–10-coated cantilever tips in Mn2+ and 10 µg/ml TS2/16 (C). For comparison, data from Fig. 3 C are replotted in A and B, and some of the data from Fig. 5 C are replotted in C, where the lifetime versus force curves of trα5β1-Fc–functionalized Petri dish dissociating from FNIII7–10-coated cantilever tips are shown as triangles, and α5β1-Fc–coated cantilever tips dissociating from GG-7–functionalized Petri dish are shown as squares. (D) Schematic of the molecular arrangement indicating binding sites for TS2/16 and 12G10.

References

    1. Akiyama S.K., Yamada S.S., Chen W.T., Yamada K.M. 1989. Analysis of fibronectin receptor function with monoclonal antibodies: roles in cell adhesion, migration, matrix assembly, and cytoskeletal organization.J. Cell Biol. 109:863–875 - PMC - PubMed
    1. Alon R., Dustin M.L. 2007. Force as a facilitator of integrin conformational changes during leukocyte arrest on blood vessels and antigen-presenting cells.Immunity. 26:17–27 - PubMed
    1. Astrof N.S., Salas A., Shimaoka M., Chen J., Springer T.A. 2006. Importance of force linkage in mechanochemistry of adhesion receptors.Biochemistry. 45:15020–15028 - PMC - PubMed
    1. Bell G.I. 1978. Models for the specific adhesion of cells to cells.Science. 200:618–627 - PubMed
    1. Chesla S.E., Selvaraj P., Zhu C. 1998. Measuring two-dimensional receptor-ligand binding kinetics by micropipette.Biophys. J. 75:1553–1572 - PMC - PubMed

Publication types

MeSH terms