Development of a type 2 diabetes risk model from a panel of serum biomarkers from the Inter99 cohort
- PMID: 19564473
- PMCID: PMC2699726
- DOI: 10.2337/dc08-1935
Development of a type 2 diabetes risk model from a panel of serum biomarkers from the Inter99 cohort
Abstract
Objective: The purpose of this study was to develop a model for assessing the 5-year risk of developing type 2 diabetes from a panel of 64 circulating candidate biomarkers.
Research design and methods: Subjects were selected from the Inter99 cohort, a longitudinal population-based study of approximately 6,600 Danes in a nested case-control design with the primary outcome of 5-year conversion to type 2 diabetes. Nondiabetic subjects, aged >or=39 years, with BMI >or=25 kg/m(2) at baseline were selected. Baseline fasting serum samples from 160 individuals who developed type 2 diabetes and from 472 who did not were tested. An ultrasensitive immunoassay was used to measure of 58 candidate biomarkers in multiple diabetes-associated pathways, along with six routine clinical variables. Statistical learning methods and permutation testing were used to select the most informative biomarkers. Risk model performance was estimated using a validated bootstrap bias-correction procedure.
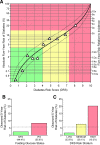
Results: A model using six biomarkers (adiponectin, C-reactive protein, ferritin, interleukin-2 receptor A, glucose, and insulin) was developed for assessing an individual's 5-year risk of developing type 2 diabetes. This model has a bootstrap-estimated area under the curve of 0.76, which is greater than that for A1C, fasting plasma glucose, fasting serum insulin, BMI, sex-adjusted waist circumference, a model using fasting glucose and insulin, and a noninvasive clinical model.
Conclusions: A model incorporating six circulating biomarkers provides an objective and quantitative estimate of the 5-year risk of developing type 2 diabetes, performs better than single risk indicators and a noninvasive clinical model, and provides better stratification than fasting plasma glucose alone.
Figures


Comment in
-
Multiple biomarker prediction of type 2 diabetes.Diabetes Care. 2009 Jul;32(7):1346-8. doi: 10.2337/dc09-0754. Diabetes Care. 2009. PMID: 19564478 Free PMC article. No abstract available.
-
Development of a type 2 diabetes risk model from a panel of serum biomarkers from the Inter99 cohort: response to Kolberg et Al.Diabetes Care. 2010 Feb;33(2):e28; author reply e29. doi: 10.2337/dc09-1780. Diabetes Care. 2010. PMID: 20103554 No abstract available.
References
-
- Blonde L: State of diabetes care in the United States. Am J Manag Care 2007; 13 ( Suppl. 2): S36– S40 - PubMed
-
- Gerstein HC, Yusuf S, Bosch J, Pogue J, Sheridan P, Dinccag N, Hanefeld M, Hoogwerf B, Laakso M, Mohan V, Shaw J, Zinman B, Holman RR: Effect of rosiglitazone on the frequency of diabetes in patients with impaired glucose tolerance or impaired fasting glucose: a randomised controlled trial. Lancet 2006; 368: 1096– 1105 - PubMed
-
- Genuth S, Alberti KG, Bennett P, Buse J, Defronzo R, Kahn R, Kitzmiller J, Knowler WC, Lebovitz H, Lernmark A, Nathan D, Palmer J, Rizza R, Saudek C, Shaw J, Steffes M, Stern M, Tuomilehto J, Zimmet P: Follow-up report on the diagnosis of diabetes mellitus. Diabetes Care 2003; 26: 3160– 3167 - PubMed
MeSH terms
Substances
LinkOut - more resources
Full Text Sources
Other Literature Sources
Medical
Research Materials

