

Optical coherence tomography is less sensitive than visual evoked potentials in optic neuritis
- PMID: 19564583
- PMCID: PMC2707110
- DOI: 10.1212/WNL.0b013e3181aaea32
Optical coherence tomography is less sensitive than visual evoked potentials in optic neuritis
Abstract
Objectives: Determine the utility of optical coherence tomography (OCT) to detect clinical and subclinical remote optic neuritis (ON), its relationship to clinical characteristics of ON and visual function, and whether the retinal nerve fiber layer (RNFL) thickness functions as a surrogate marker of global disease severity.
Methods: Cross-sectional study of 65 subjects with at least 1 clinical ON episode at least 6 months prior. Measures included clinical characteristics, visual acuity (VA), contrast sensitivity (CS), OCT, and visual evoked potentials (VEP).
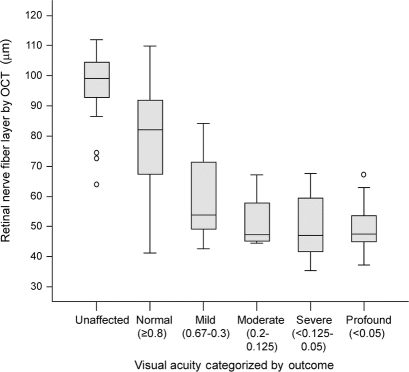
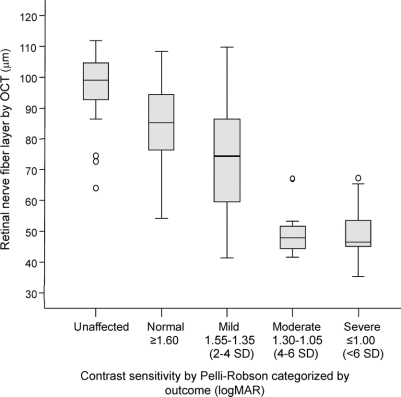
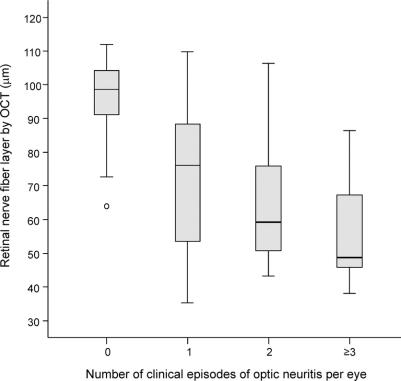
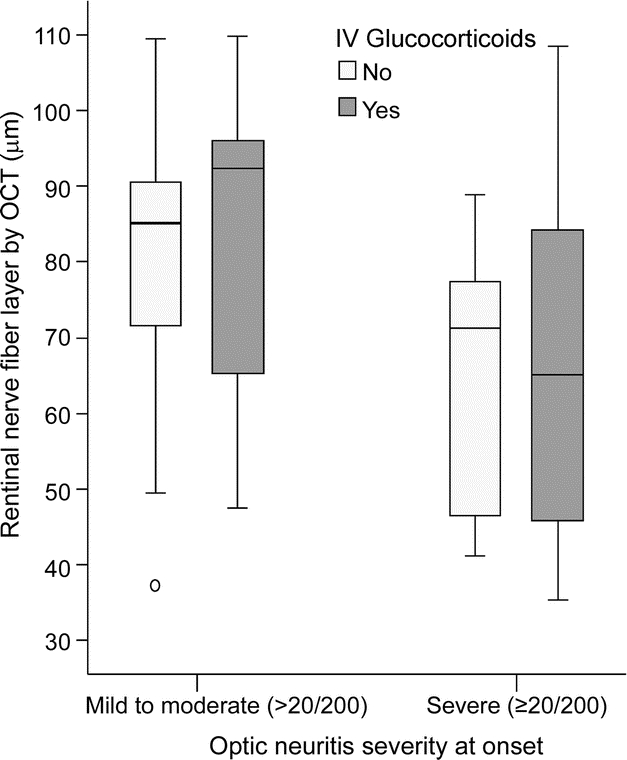
Results: Ninety-six clinically affected optic nerves were studied. The sensitivity of OCT RNFL after ON was 60%, decreasing further with mild onset and good recovery. VEP sensitivity was superior at 81% (p = 0.002). Subclinical ON in the unaffected eye was present in 32%. VEP identified 75% of all subclinically affected eyes, and OCT identified <20%. RNFL thickness demonstrated linear correlations with VA (r = 0.65) and CS (r = 0.72) but was unable to distinguish visual categories <20/50. RNFL was thinner with severe onset and disease recurrence but was unaffected by IV glucocorticoids. OCT measurements were not related to overall disability, ethnicity, sex, or age at onset. The greatest predictor for RNFL in the unaffected eye was the RNFL in the fellow affected eye.
Conclusions: Visual evoked potentials (VEP) remains the preferred test for detecting clinical and subclinical optic neuritis. Optical coherence tomography (OCT) measures were unrelated to disability and demographic features predicting a worse prognosis in multiple sclerosis. OCT may provide complementary information to VEP in select cases, and remains a valuable research tool for studying optic nerve disease in populations.
Figures
Similar articles
-
Optical coherence tomography versus visual evoked potentials in detecting subclinical visual impairment in multiple sclerosis.J Med Life. 2014 Oct-Dec;7(4):538-41. J Med Life. 2014. PMID: 25713617 Free PMC article.
-
Optimization of spectral domain optical coherence tomography and visual evoked potentials to identify unilateral optic neuritis.Mult Scler Relat Disord. 2020 Jun;41:101988. doi: 10.1016/j.msard.2020.101988. Epub 2020 Feb 7. Mult Scler Relat Disord. 2020. PMID: 32092503
-
Optical coherence tomography and visual evoked potentials: which is more sensitive in multiple sclerosis?Mult Scler. 2014 Sep;20(10):1342-7. doi: 10.1177/1352458514524293. Epub 2014 Mar 3. Mult Scler. 2014. PMID: 24591532
-
Optical coherence tomography in optic neuritis and multiple sclerosis: a review.Eur J Neurol. 2007 Aug;14(8):841-9. doi: 10.1111/j.1468-1331.2007.01736.x. Eur J Neurol. 2007. PMID: 17662003 Review.
-
Assessing structure and function of the afferent visual pathway in multiple sclerosis and associated optic neuritis.J Neurol. 2009 Mar;256(3):305-19. doi: 10.1007/s00415-009-0123-z. Epub 2009 Mar 18. J Neurol. 2009. PMID: 19296047 Review.
Cited by
-
Multiple sclerosis: can retinal imaging accurately detect optic neuritis?Nat Rev Neurol. 2010 Mar;6(3):125-6. doi: 10.1038/nrneurol.2010.13. Nat Rev Neurol. 2010. PMID: 20212426 No abstract available.
-
Modulation of cortical activity by spherical blur and its correlation with retinal defocus.Front Neurosci. 2023 Jul 13;17:1184381. doi: 10.3389/fnins.2023.1184381. eCollection 2023. Front Neurosci. 2023. PMID: 37521696 Free PMC article.
-
[Optic neuropathy after retrobulbar neuritis in multiple sclerosis: are optical coherence tomography and magnetic resonance imaging useful and necessary follow-up parameters?].Nervenarzt. 2015 Feb;86(2):187-96. doi: 10.1007/s00115-014-4241-1. Nervenarzt. 2015. PMID: 25645891 Clinical Trial. German.
-
The value of the visual evoked potentials test in the assessment of the visual pathway in head trauma.J Inj Violence Res. 2021 Jan;13(1):1-4. doi: 10.5249/jivr.v13i1.1525. Epub 2020 Aug 15. J Inj Violence Res. 2021. PMID: 32868496 Free PMC article.
-
The effect of optic neuritis treatment trial (ONTT) combined corticosteroid regimen on pattern reversal visual evoked potentials: a prospective follow-up study.BMC Ophthalmol. 2021 Sep 6;21(1):324. doi: 10.1186/s12886-021-02086-z. BMC Ophthalmol. 2021. PMID: 34488685 Free PMC article.
References
-
- Toth CA, Narayan DG, Boppart ST, et al. A comparison of retinal morphology viewed by optical coherence tomography and by light microscopy. Arch Ophthalmol 1997;115:1425–1428. - PubMed
-
- Chen TC, Cense B, Miller JW, et al. Histologic correlation of in vivo optical coherence tomography images of the human retina. Am J Ophthalmol 2006;141:1165–1168. - PubMed
-
- Yucel YH, Gypta N, Kalichman MW, et al. Relationship of optic disc topography to optic nerve fiber number in glaucoma. Arch Opthalmol 1998;116:493–497. - PubMed
-
- Costello F, Hodge W, Pan Y, Eggenberger E, Coupland S, Kardon RH. Tracking retinal nerve fiber layer loss after optic neuritis: a prospective study using optical coherence tomography. Mult Scler 2008;14:893–905. - PubMed
Publication types
MeSH terms
Grants and funding
LinkOut - more resources
Full Text Sources
Medical
Miscellaneous