

Review
doi: 10.1038/nrg2583.
Evolutionary analysis of the dynamics of viral infectious disease
Affiliations
- PMID: 19564871
- PMCID: PMC7097015
- DOI: 10.1038/nrg2583
Item in Clipboard
Review
Evolutionary analysis of the dynamics of viral infectious disease
Nat Rev Genet.
2009 Aug.
Abstract
Many organisms that cause infectious diseases, particularly RNA viruses, mutate so rapidly that their evolutionary and ecological behaviours are inextricably linked. Consequently, aspects of the transmission and epidemiology of these pathogens are imprinted on the genetic diversity of their genomes. Large-scale empirical analyses of the evolutionary dynamics of important pathogens are now feasible owing to the increasing availability of pathogen sequence data and the development of new computational and statistical methods of analysis. In this Review, we outline the questions that can be answered using viral evolutionary analysis across a wide range of biological scales.
Figures
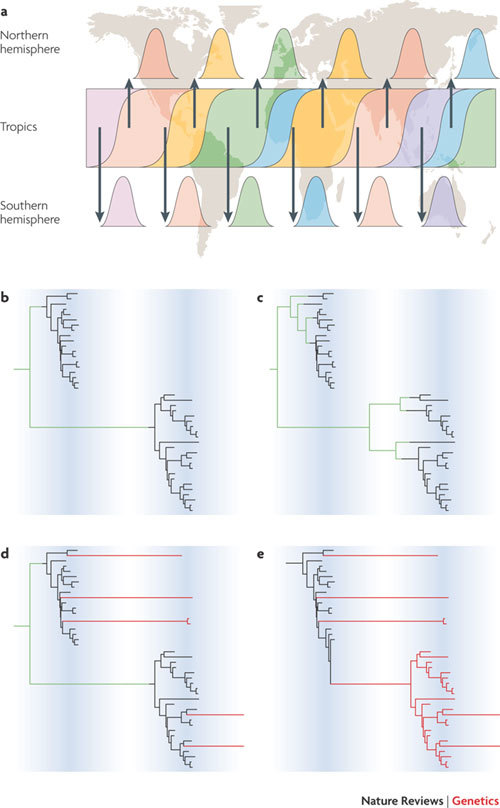
Human influenza A virus exhibits a complex pattern of global seasonal dynamics, with epidemics in temperate areas occurring during the winter and year-round sporadic outbreaks in the tropics. Recent analyses indicate that these dynamics are best described by a source–sink model of viral population structure, with a persistent reservoir in South-East Asia driving viral diversity worldwide,. a | Complete genome sequences sampled from New York State, USA, and from Australia and New Zealand have provided a high-resolution snapshot of diversity in these locales over successive seasons,. Continuous transmission of influenza in the reservoir populations allows natural selection for antigenic diversity, whereas the sink populations with seasonal dynamics will tend to be a representative sample of this diversity. b–d | Different patterns of global gene flow will be reflected in the phylogenies of influenza isolates sampled from sequential epidemics in one location. b | The entire diversity of the second season is descended from a single lineage originating from the global reservoir (lineages representing this global reservoir are in green). c | As part b, but with multiple lineages from the global reservoir seeding each season. d | As part b, but with a few lineages persisting locally (red) from one season to the next. e | The entire second season is descended from local lineages, implying that transmission persists from season to season in this location. Part a is modified, with permission, from Ref. © Nature (2008) Macmillan Publishers Ltd, all rights reserved.
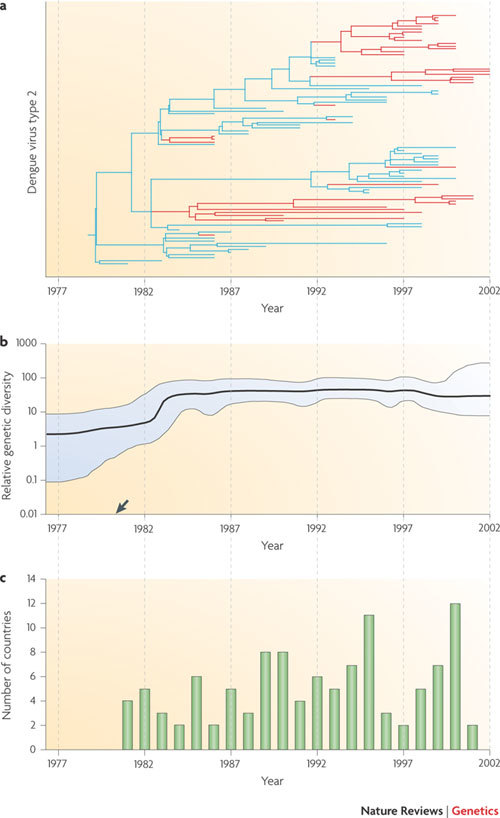
a | A molecular clock phylogeny that illustrates the history of dengue virus genotype 2 infection in the Caribbean and in Central and South America. A simple parsimony approach has been used to reconstruct the likely location of each phylogenetic branch (blue, Caribbean islands; red, mainland Central America and mainland South America). By combining phylogenetic and geographic information, the phylogeny indicates that the outbreak began in the Caribbean before repeatedly and independently invading mainland locations some years later. b | An estimate of the relative genetic diversity of the same dengue virus epidemic, which shows an initial increase before stabilizing (95% confidence limits shown in blue). This stabilization does not match the varying number of reported dengue outbreaks (shown in part c), probably because spatial population structure maintains viral diversity across epidemic peaks and troughs. More generally, when the sampled population exhibits strong positive selection or population structure then the y-axis cannot be reliably interpreted as proportional to effective population size. The estimated common ancestor of the sampled sequences (arrow) is dated slightly earlier than the first reported outbreak in the region (see part c). c | Shows the number of countries affected by dengue virus genotype 2 infection per year. Figure is modified, with permission, from Ref. © (2005) American Society for Microbiology.
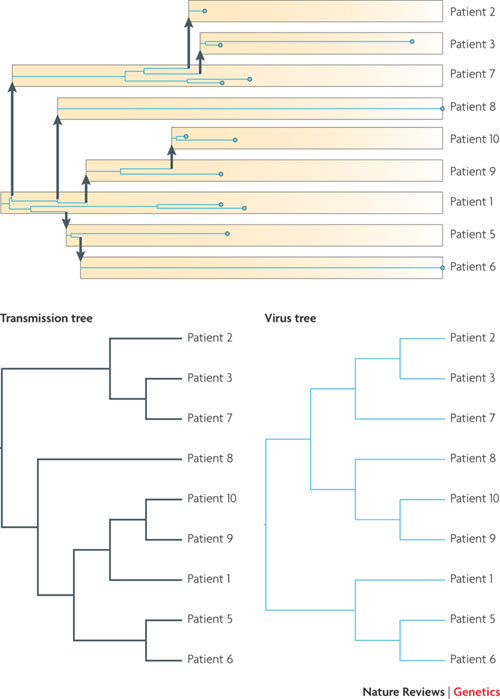
A phylogeny of 13 HIV-1 viral particles (blue circles) sampled at different times (horizontal axis) from 9 different patients for whom the times and direction of viral transmission are known. The virus phylogeny (blue lines) can be mapped within the transmission tree (yellow boxes and arrows), analogous to the mapping of a gene genealogy within a species tree. We can trace all the viruses sampled from one patient back to the time of transmission. Whether more than one lineage is transmitted at this time from the donor will depend on the size of the genetic bottleneck at transmission. Even in the presence of a tight bottleneck, a diverse population in the donor can result in lineage sorting, with the result that the topology of the virus phylogenetic tree does not exactly match the transmission tree.
References
-
- Duffy S, Shackelton LA, Holmes EC. Rates of evolutionary change in viruses: patterns and determinants. Nature Rev. Genet. 2008;9:267–276. - PubMed
-
- Grenfell BT, et al. Unifying the epidemiological and evolutionary dynamics of pathogens. Science. 2004;303:327–332. - PubMed
-
- Holmes EC, Nee S, Rambaut A, Garnett GP, Harvey PH. Revealing the history of infectious disease epidemics through phylogenetic trees. Philos. Trans. R. Soc. Lond. B. 1995;349:33–40. - PubMed
Publication types
MeSH terms
LinkOut - more resources
Full Text Sources
Medical
