

doi: 10.1002/anie.200901550.
Microfluidic confinement of single cells of bacteria in small volumes initiates high-density behavior of quorum sensing and growth and reveals its variability
Affiliations
- PMID: 19565587
- PMCID: PMC2748941
- DOI: 10.1002/anie.200901550
Item in Clipboard
Microfluidic confinement of single cells of bacteria in small volumes initiates high-density behavior of quorum sensing and growth and reveals its variability
Angew Chem Int Ed Engl.
2009.
No abstract available
Figures
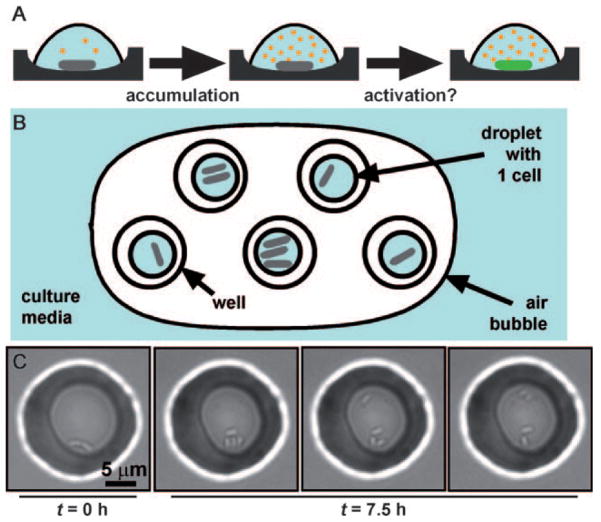
A hypothesis for activation of QS by confinement of single cells and a device for testing this hypothesis. A) Pseudomonas aeruginosa cells (gray rods) excrete auto inducers (AIs, orange circles) that can accumulate in the media. In a confined volume, the AIs do not diffuse away, and thus they reach high concentrations around the cell. We hypothesized that in a small volume, a single cell would be able to accumulate AIs above the critical concentration needed to initiate QS. In these experiments, QS was visualized by using a green-fluorescent protein (GFP) reporter gene for lasB (green rod). B) Schematic drawing of arrays of sub-picoliter droplets that contain confined bacteria covered by air. The entire device is sealed inside a petri dish (not shown). C) Small groups of bacteria can grow and divide when confined in droplets with volumes less than 1 pL. After 7.5 h, the original cell has divided, as shown by the increase in the number of cells in the droplet, and the bacteria are also motile, as indicated by the series of pictures, taken several seconds apart, showing movement of some of the cells in the droplet.
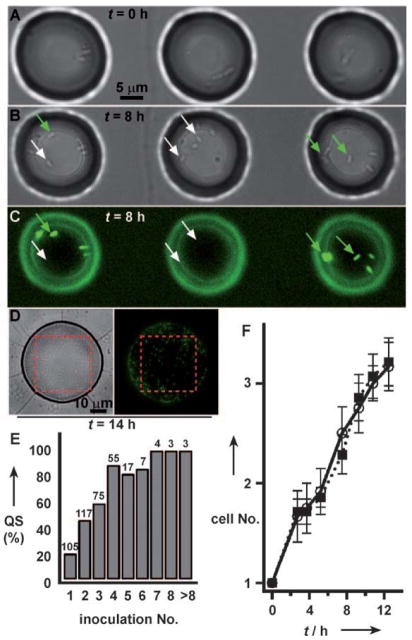
Small populations of clonal cells initiate QS upon confinement (Supporting Information; movie S2), and do so with marked variability. A)–C) Three adjacent droplets, each containing a small population of cells at time zero, show variability in initiation of QS after 8 h. White arrows point to cells that did not initiate QS; green arrows point to cells that initiated QS. D) Cells in a larger droplet (ca. 20 pL) grew to a population of hundreds of cells and show more homogeneous expression of QS, as visualized by the fluorescence reporter. Inside the red dashed boxes, cell counts are 109 total (from bright field, left), and 98 initiated QS (from GFP, right). E) Initiation of QS in droplets, loaded at time zero with 1 to 14 cells, was measured after 10 h, demonstrating increased variability in initiation of QS within small groups of cells. A well was scored as “with QS” if at least one bacterium in the well was fluorescent. Inoculation No. is the initial number of cells; the bar for >8 represents groups of 9, 10, and 14 cells at t =0. Numbers above bars represent the total number of wells N for that inoculation number. F) Initiation of QS in droplets containing single cells at time zero was not correlated with the growth rate of the cells. Bars represent standard error. ○,—: droplets that achieved quorum sensing; ■,•••••: droplets that did not achieve quorum sensing.
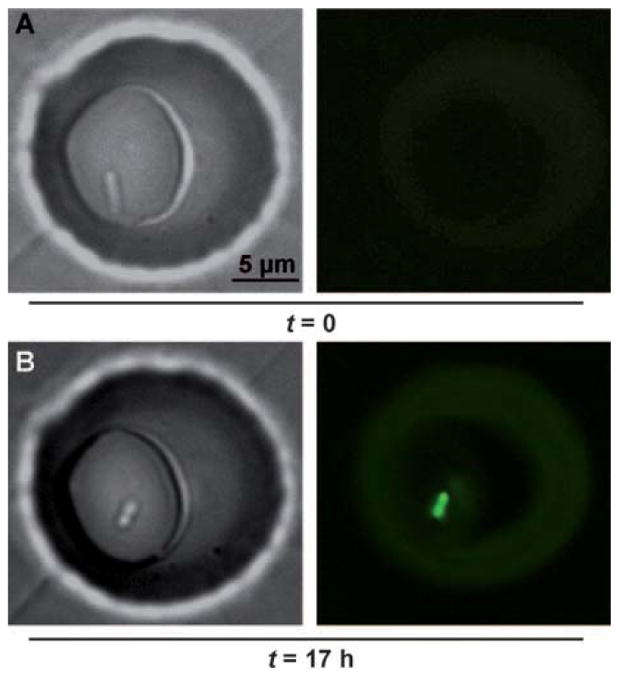
A single Pseudomonas aeruginosa bacterium, originating from a low-density culture, initiated QS after confinement for 17 h in an approximately 200 fL droplet. Bright-field images show the bacterium at 0 h (A) and 17 h (B). Fluorescent images show activation of QS after 17 h, as visualized by the expression of fluorescent reporter for the QS-controlled gene lasB.
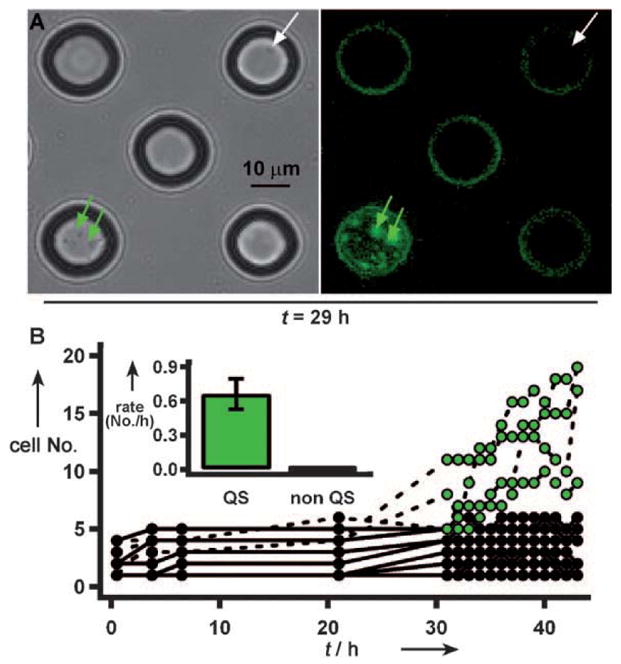
In media with adenosine as the sole carbon source, small groups of bacteria did not divide more than a few times, unless they initiated QS. A) Both wells indicated by arrows started with one cell at t =0. After 29 h, a well with cells that had initiated QS (green arrows) contained a population of tens of cells, whereas in a well with cells which did not initiate QS (white arrow) the cells did not divide. Fluorescence on the edges of wells is an artifact. B) After 31 h, bacteria in 4 of 16 wells (50 μm diameter) initiated QS, (green dots, dashed lines). Inset: the growth rate of the cells which initiated QS, 0.7 cellshour−1, is significantly higher than the growth rate of cells which did not initiate QS, 0.01 cellshour−1 (p <0.0001). Error bars are standard error. Owing to inaccuracies in counting moving cells which occupy multiple imaging planes, counts at any time have an error of approximately 1–4 cells.
References
Publication types
MeSH terms
Substances
Grants and funding
LinkOut - more resources
Full Text Sources
Other Literature Sources
