. 2009 Aug 27;114(9):1904-12.
doi: 10.1182/blood-2009-02-203216. Epub 2009 Jun 30.

Adducin forms a bridge between the erythrocyte membrane and its cytoskeleton and regulates membrane cohesion

Affiliations

Adducin forms a bridge between the erythrocyte membrane and its cytoskeleton and regulates membrane cohesion

William A Anong et al. Blood. .

Abstract

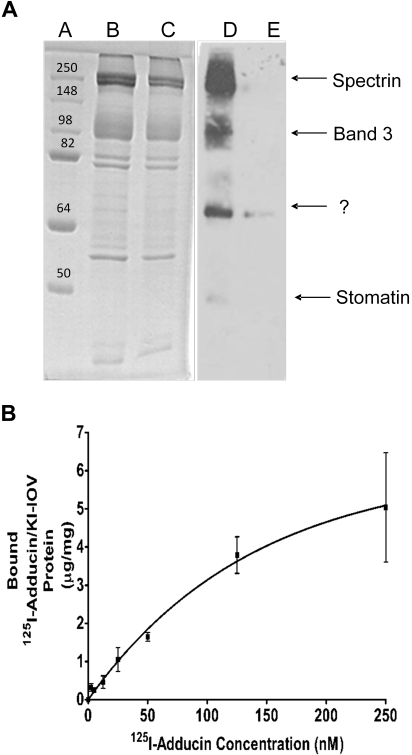
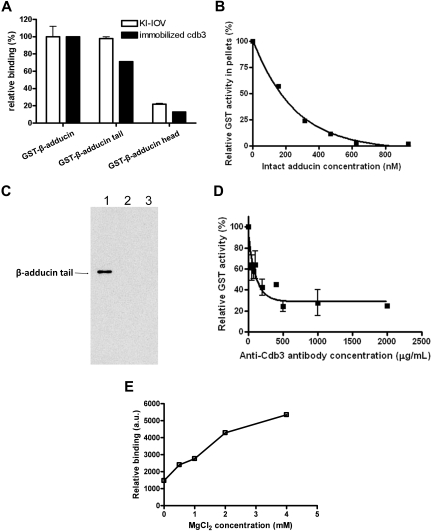
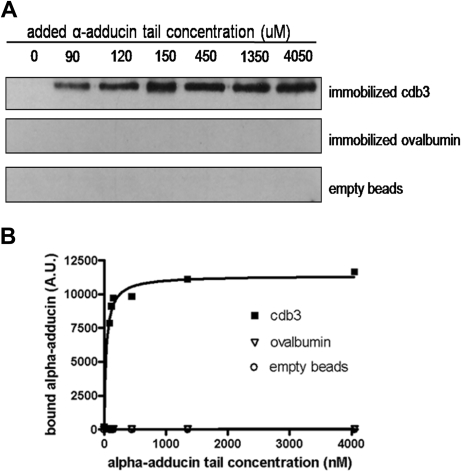
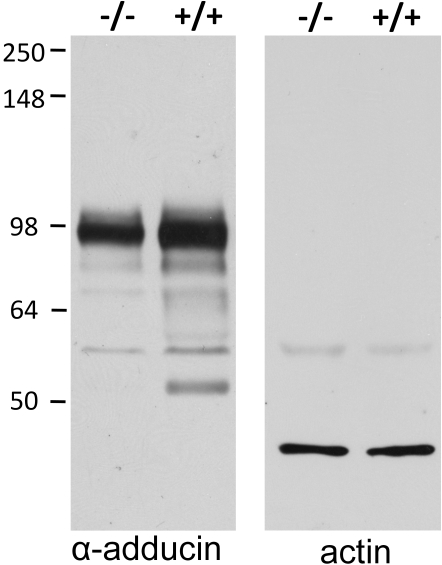
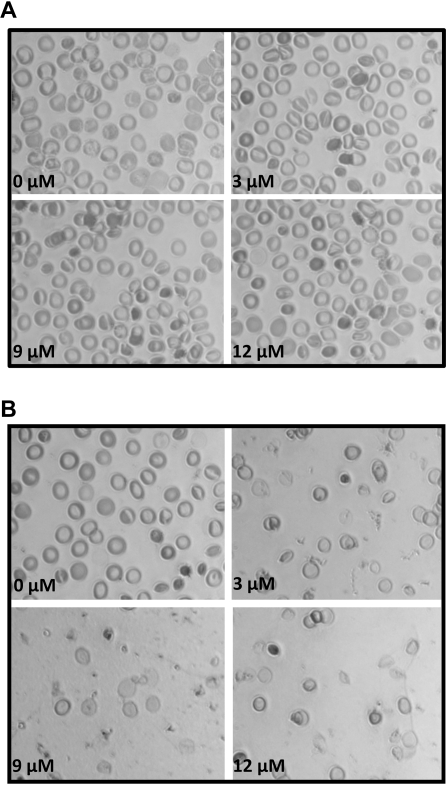
The erythrocyte membrane skeleton is the best understood cytoskeleton. Because its protein components have homologs in virtually all other cells, the membrane serves as a fundamental model of biologic membranes. Modern textbooks portray the membrane as a 2-dimensional spectrin-based membrane skeleton attached to a lipid bilayer through 2 linkages: band 3-ankyrin-beta-spectrin and glycophorin C-protein 4.1-beta-spectrin.(1-7) Although evidence supports an essential role for the first bridge in regulating membrane cohesion, rupture of the glycophorin C-protein 4.1 interaction has little effect on membrane stability.(8) We demonstrate the existence of a novel band 3-adducin-spectrin bridge that connects the spectrin/actin/protein 4.1 junctional complex to the bilayer. As rupture of this bridge leads to spontaneous membrane fragmentation, we conclude that the band 3-adducin-spectrin bridge is important to membrane stability. The required relocation of part of the band 3 population to the spectrin/actin junctional complex and its formation of a new bridge with adducin necessitates a significant revision of accepted models of the erythrocyte membrane.


Figures

Figure 1
Figure 1
Adducin-binding proteins in KI-IOVs revealed by label transfer and copelleting experiments. (A) β-Adducin–binding proteins in IOVs revealed by label transfer experiments. Purified β-adducin tail (expressed in E coli) was incubated in the dark with a 2-fold molar excess of sulfo-SBED for 3 hours at 4°C, after which the protein solution was dialyzed overnight against PBS to remove unbound sulfo-SBED. IOVs (200 μg protein) were incubated with the above labeled β-adducin tail for 1 hour at room temperature in the dark to allow membrane association, after which cross-linking to nearest neighbor proteins was activated on ice by exposure for 15 minutes to a 302-nm light source (18.4 W) at a distance of 5 cm. A total of 10 mM dithiothreitol was then added to reduce the disulfide linkage between sulfo-SBED–adducin and its membrane anchor, and the labeled membrane anchor containing the transferred biotin was analyzed by SDS-PAGE, followed by transfer to nitrocellulose and visualization with streptavidin–horseradish peroxidase. Coomassie blue–stained gel lanes A through C contain molecular weight standards (lane A), or IOVs incubated with labeled β-adducin tail either in the absence (lane B) or presence (lane C) of a 20-fold excess of unlabeled β-adducin tail to competitively block all adducin binding sites on the IOVs. Lanes D and E represent streptavidin–horseradish peroxidase blots of lanes B and C. (B) KI-IOVs (100 μg) were incubated with increasing amounts of 125I-adducin (purified from mature erythrocytes) or 125I-BSA (60 μL total volume) for 2 hours at room temperature in a buffer consisting of phosphate-buffered saline containing 10% sucrose, protease inhibitor mixture, 1 mg/mL BSA, and no Mg2+. Bound proteins were separated by centrifugation through a 25% sucrose cushion and quantified by γ counting. The BSA control was subtracted. Data points represent mean ± SD, n = 2. An apparent KD of approximately 100 nM was calculated assuming a noncooperative, single site–binding equilibrium.
Figure 2
Figure 2
Identification of the adducin domain that interacts with KI-IOVs and band 3. (A) Native GST fusion constructs of intact adducin and its domains (1 μM) were incubated overnight at 4°C with KI-IOVs (65 μg in 200 μL; □) or with cdb3-(His)6 (5.5 μM; ■). The KI-IOV suspension was pelleted through a 25% sucrose cushion, whereas the cdb3-(His)6 solution was captured on nickel-nitrilotriacetic acid beads, washed 4 times, and eluted with 250 mM imidazole. GST activity was then quantified as a measure of adducin content. Data points represent mean ± SD, n = 2. Data were independently confirmed by dot blot analysis with anti-GST (data not shown). (B) Competitive inhibition of GST–β-adducin tail binding to KI-IOVs by intact erythrocyte adducin. KI-IOVs (100 μg of protein) were incubated with increasing amounts of intact erythrocyte adducin for 4 hours at 4°C (100 μL total volume), after which GST–β-adducin tail (250 nM) was added and incubated overnight at 4°C. Samples were processed and quantitated, as described above. Data points represent mean ± SD, n = 2 (apparent KI ∼150 nM). (C) Verification of β-adducin tail binding with cdb3 by GST pull-down assay. GST-tagged cytoplasmic domain of band 3 was coupled to glutathione beads, pelleted, and washed (as described above). His-tagged C terminus of β-adducin was added to the mixture. The GST–band 3–conjugated beads (lane 1) at a final concentration of 1 μM were incubated for 1 hour at room temperature, pelleted, and then washed. The pellet was analyzed by SDS-PAGE, and β-adducin fragment was detected by Western blotting using anti-His antibody. GST-tagged cytoplasmic domain of glycophorin C (lane 2) and GST alone (lane 3) were used as negative controls. (D) Competitive inhibition of GST–β-adducin tail binding to KI-IOVs by anti-cdb3 antibody. KI-IOVs (70 μg, 200 μL total volume) were incubated with increasing amounts of anti-cdb3 antibody for 4 hours at 4°C, after which GST–β-adducin tail (1500 nM) was added and incubated overnight at 4°C. Samples were processed and GST activity was quantitated, as described above. Data points represent mean ± SD, n = 2. (E) The association of GST–β-adducin tail with band 3 requires Mg2+. His-tagged band 3 was immobilized on nickel beads and incubated with 270 nM GST–β-adducin tail in the presence of increasing concentrations of MgCl2. Beads were pelleted, washed 5 times, and eluted with 250 mM imidazole in PBS. Eluted proteins were transferred to nitrocellulose membranes and probed for GST–β-adducin tail with an anti-GST polyclonal antibody. a.u. represents arbitrary units.
Figure 3
Figure 3
Concentration dependence of α-adducin tail binding to immobilized cdb3. Cytoplasmic domain of band 3, ovalbumin, or no protein was reacted with Affi-Gel 15 beads, as described in “Binding of α-adducin tail to cdb3 immobilized on Affi-Gel 15.” Different concentrations of His-tagged α-adducin tail were incubated with the protein-derivatized beads for 4 hours at 4°C with gentle shaking. Beads were pelleted, washed 3 times with PBS, eluted, separated electrophoretically by SDS-PAGE, and analyzed by Western blotting using anti–α-adducin antibody (A). Quantitative densitometry was performed using Image J, and the resulting data were fit to a noncooperative single site-binding equilibrium, which yielded an apparent KD of 35 ± 7 nM (B). A.U. indicates arbitrary units.
Figure 4
Figure 4
Intact band 3–null erythrocytes have reduced adducin content. Intact erythrocytes from wild-type (+/+) and band 3–null (−/−) mice were washed, plunged into 5× SDS-PAGE sample buffer, separated by SDS-PAGE, blotted onto nitrocellulose, and visualized with antibodies to adducin (left) and actin (right). Quantitative densitometry of 2 independent samples demonstrates a 35% decrease in adducin content of −/− erythrocytes.
Figure 5
Figure 5
Analysis of the morphology of erythrocytes resealed in the presence of α- and β-adducin tail domains. Increasing concentrations of (A) α- and (B) β-adducin tail domains (0-12 μM) were incubated for 1 hour on ice with leaky erythrocytes (500 μL) at 50% Hct and then resealed for 45 minutes at 37°C in PBS containing 4 mM MgCl2.
Figure 6
Figure 6
Effect of increasing concentrations of α- and β- adducin tail domains on retention of band 3 in detergent-extracted membrane skeletons. (A) Increasing concentrations of α-adducin tail were incubated for 1 hour on ice with leaky ghosts (5 mg/mL protein). Mg2+ was then added to a final concentration of 4 mM, and the leaky ghosts were incubated for another 30 minutes. Ghosts were resealed in PBS for 45 minutes at 37°C and then extracted in 1% Triton X-100 (final concentration). Pelleted skeletons were analyzed by SDS-PAGE and immunoblotting using anti–band 3 and anti-actin antibodies. Densitometry of band 3/actin ratios revealed a reduction in band 3 content of 0%, 25%, 33%, and 37% in extracted membrane skeletons from red cells resealed with 0 μM, 3 μM, 9 μM, and 15 μM α-adducin tail, respectively. Whereas no change in spectrin, ankyrin, CD47, or glycophorin A retention was observed, protein 4.1, glycophorin C, and GAPDH content in the skeletons were reduced approximately 22%, 17%, and 31%, respectively. (B) Increasing concentrations of GST–β-adducin tail were incubated for 4 hours on ice with leaky erythrocytes (3 mg/mL protein) and then resealed for 45 minutes at 37°C. Resealed cells were extracted in 2% Triton X-100 (final concentration), and skeletons were analyzed by SDS-PAGE, followed by immunoblotting with anti-cdb3 and anti-actin antibodies. Densitometry of band 3/actin ratios indicate ∼ 50% ± 8% reduction in band 3 content at 15 μM GST–β-adducin tail, n = 2. Densitometry of band 3/actin ratios revealed a reduction in band 3 content of 0%, 17%, 21%, and 38% in extracted membrane skeletons from red cells resealed with 0 μM, 3 μM, 9 μM, and 15 μM β-adducin tail, respectively. Whereas no change in spectrin, ankyrin, CD47, or glycophorin A retention was observed, protein 4.1, glycophorin C, and GAPDH content in the skeletons was reduced ∼ 28%, 30%, and 25%, respectively.
Figure 7
Figure 7
Revised model of the human erythrocyte membrane. Model shows the newly established band 3-to-adducin bridge to the junctional complex and the segregation of skeletally anchored band 3 into 2 distinct populations, one at the junctional complex and the second near the center of the spectrin tetramer where ankyrin binds.

References

    1. Alberts B, Johnson A, Lewis J, Roberts K, Walter P, Baff M. Molecular Biology of the Cell. 5th Ed. New York, NY: Garland Science Publishing; 2008.
    1. Beutler E, Lichtman MA, Coller BS, Kipps TJ, Seligshon U. Williams Hematology. 6th Ed. New York, NY: McGraw-Hill Professional; 2000.
    1. Cooper GM, Hausman RE. The Cell: A Molecular Approach. 3rd Ed. Washington, DC: ASM Press; 2004.
    1. Greer JP, Foerster J, Lukens JN, Rodgers GM, Paraskevas F, Glader B. Wintrobe's Clinical Hematology. 11th Ed. Baltimore, MD: Lippincott Williams & Wilkins; 2003.
    1. Metzler DE. Biochemistry: The Chemical Reactions of the Living Cells. 2nd Ed. Vol 1. New York, NY: Academic Press; 2001.

Publication types

MeSH terms