

Race and space in the 1990s: changes in the geographic scale of racial residential segregation, 1990-2000
- PMID: 19569292
- PMCID: PMC4057018
- DOI: 10.1016/j.ssresearch.2008.10.002
Race and space in the 1990s: changes in the geographic scale of racial residential segregation, 1990-2000
Abstract
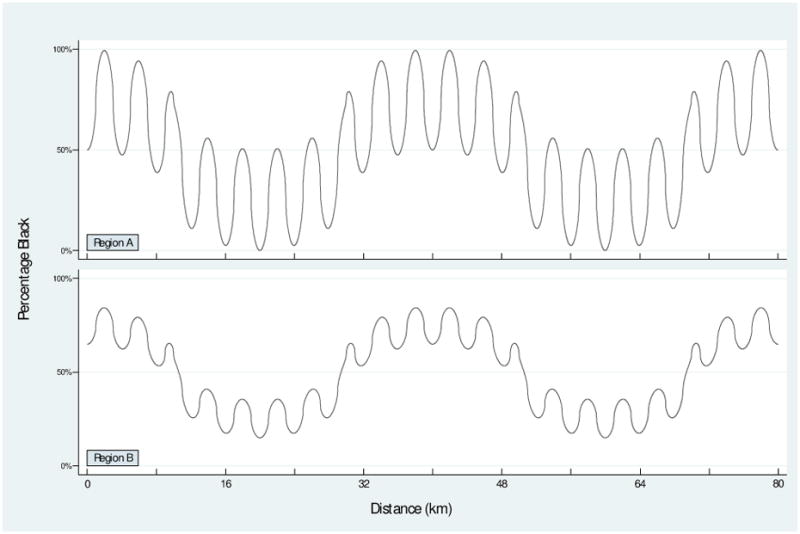
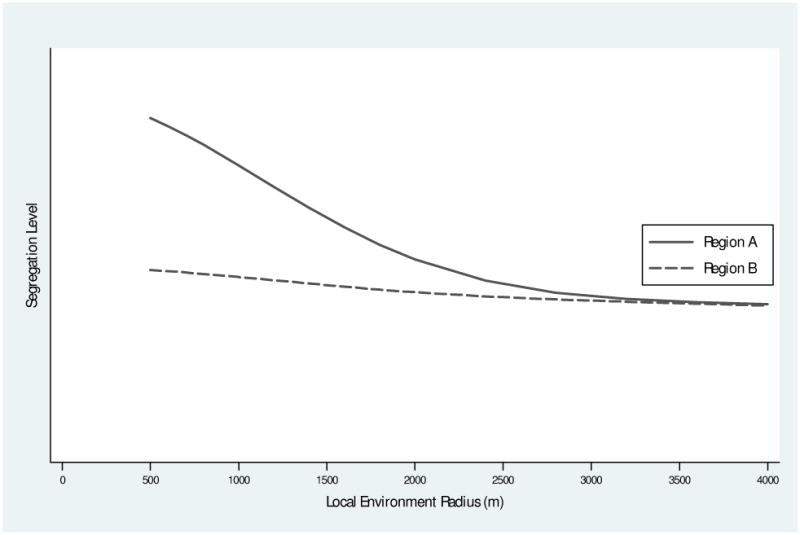
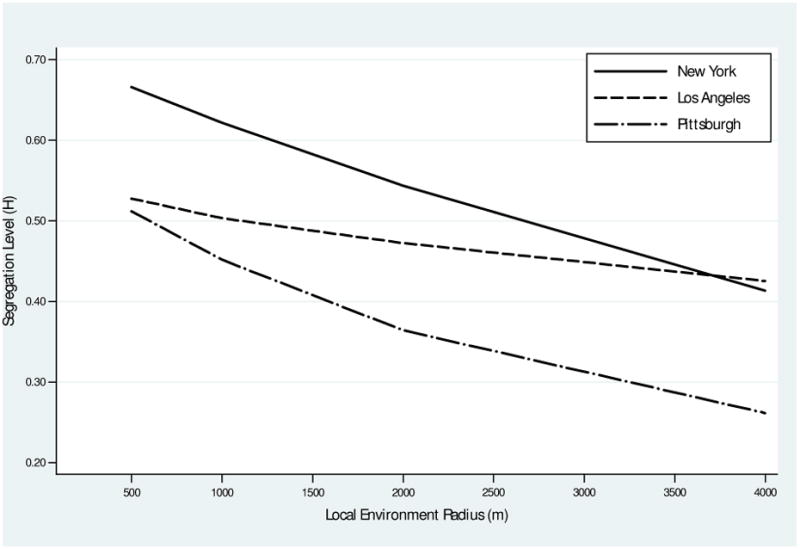
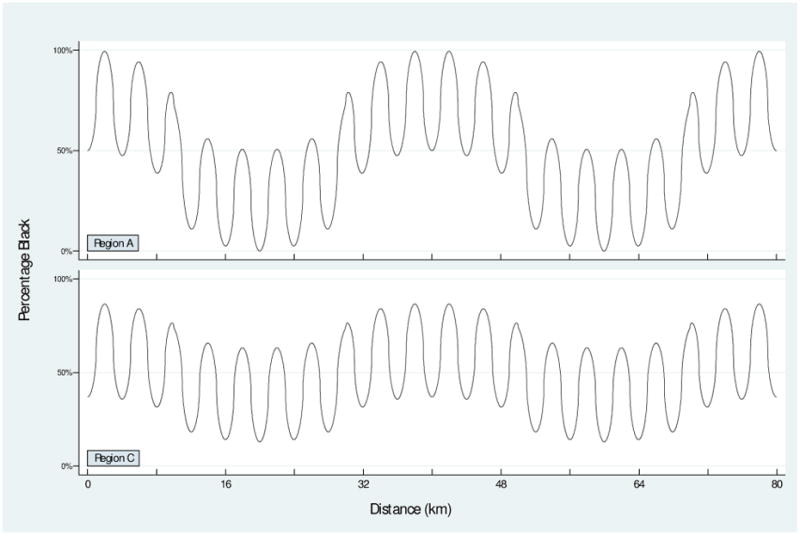
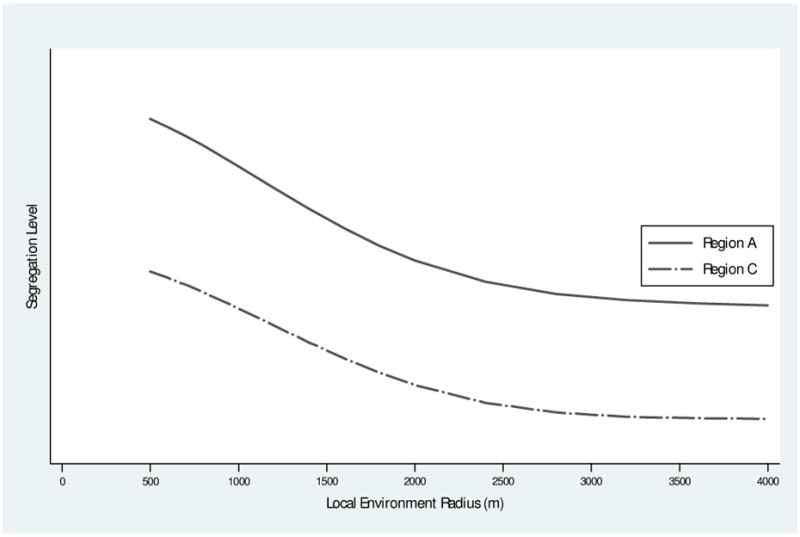
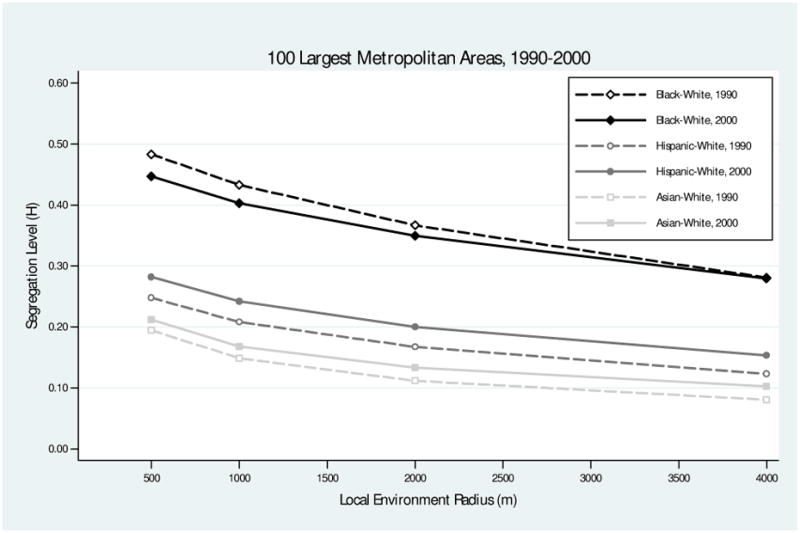
We use newly developed methods of measuring spatial segregation across a range of spatial scales to assess changes in racial residential segregation patterns in the 100 largest U.S. metropolitan areas from 1990 to 2000. Our results point to three notable trends in segregation from 1990 to 2000: (1) Hispanic-white and Asian-white segregation levels increased at both micro- and macro-scales; (2) black-white segregation declined at a micro-scale, but was unchanged at a macro-scale; and (3) for all three racial groups and for almost all metropolitan areas, macro-scale segregation accounted for more of the total metropolitan area segregation in 2000 than in 1990. Our examination of the variation in these trends among the metropolitan areas suggests that Hispanic-white and Asian-white segregation changes have been driven largely by increases in macro-scale segregation resulting from the rapid growth of the Hispanic and Asian populations in central cities. The changes in black-white segregation, in contrast, appear to be driven by the continuation of a 30-year trend in declining micro-segregation, coupled with persistent and largely stable patterns of macro-segregation.
Figures
References
-
- Charles CZ. The dynamics of racial residential segregation. Annual Review of Sociology. 2003;29:167–207.
-
- Cowgill DO, Cowgill MS. An index of segregation based on block statistics. American Sociological Review. 1951;16(6):825–831.
-
- Dawkins CJ. Spatial changes in income segregation during the 1990s; Paper presented at the annual meeting of the Association of American Geographers; Chicago, IL. 2006.
-
- Duncan OD, Duncan B. A methodological analysis of segregation indexes. American Sociological Review. 1955 Apr;20(2):210–217.
-
- Echemque F, Fryer RG. On the measurement of segregation 2005
Publication types
MeSH terms
Grants and funding
LinkOut - more resources
Full Text Sources