Comparative Study
. 2009 Jul;27(1):E9.
doi: 10.3171/2009.4.FOCUS0974.

Human neocortical electrical activity recorded on nonpenetrating microwire arrays: applicability for neuroprostheses

Affiliations
Comparative Study

Human neocortical electrical activity recorded on nonpenetrating microwire arrays: applicability for neuroprostheses

Spencer S Kellis et al. Neurosurg Focus. 2009 Jul.

Abstract

Object: The goal of this study was to determine whether a nonpenetrating, high-density microwire array could provide sufficient information to serve as the interface for decoding motor cortical signals.

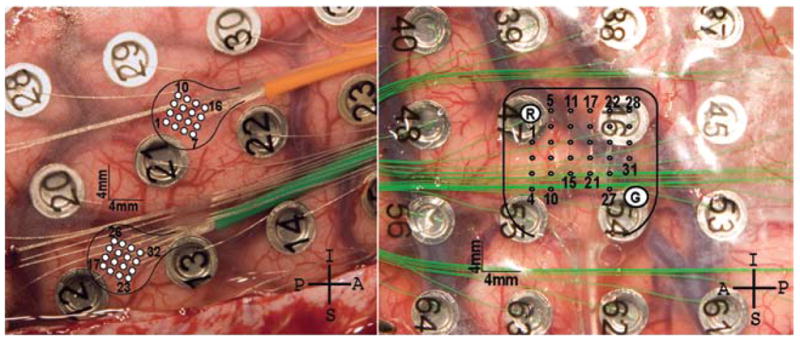
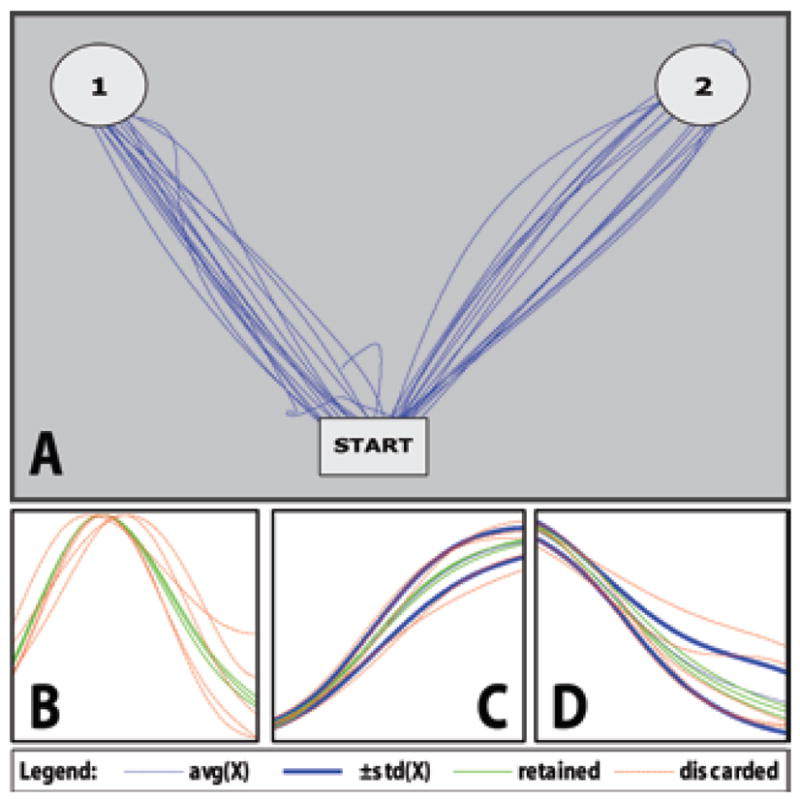
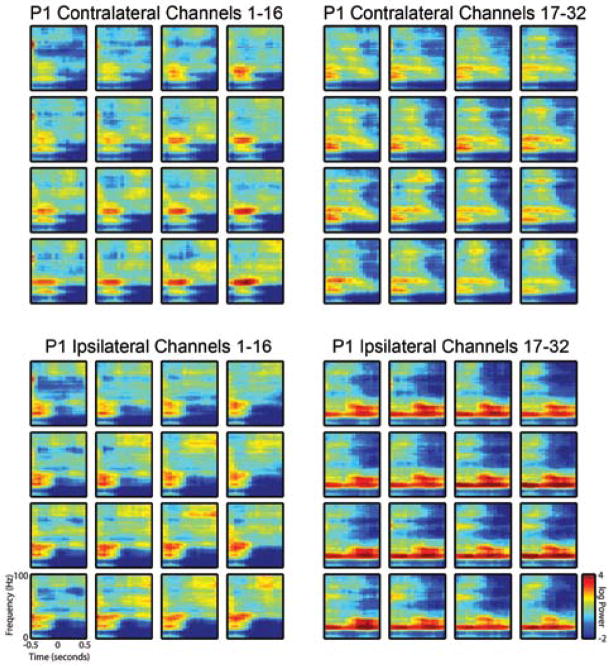
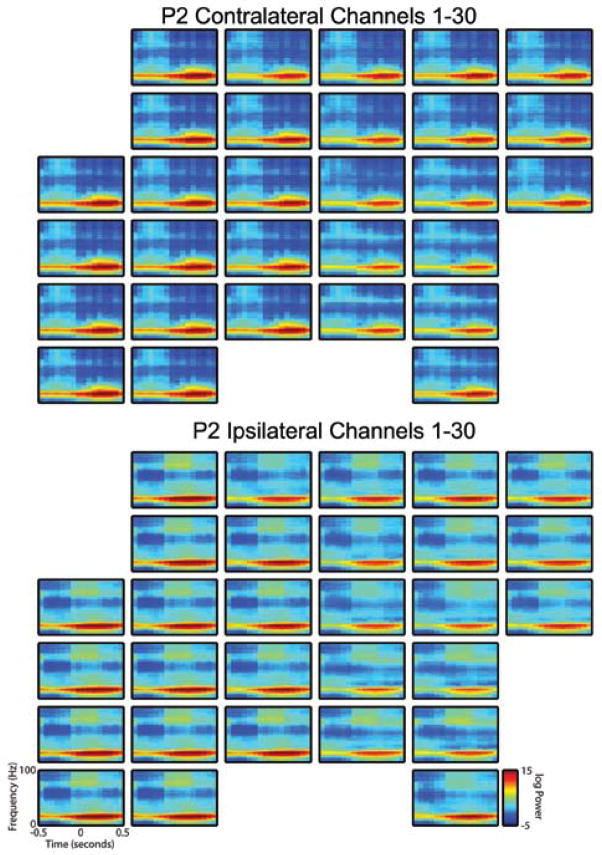
Methods: Arrays of nonpenetrating microwires were implanted over the human motor cortex in 2 patients. The patients performed directed stereotypical reaching movements in 2 directions. The resulting data were used to determine whether the reach direction could be distinguished through a frequency power analysis.

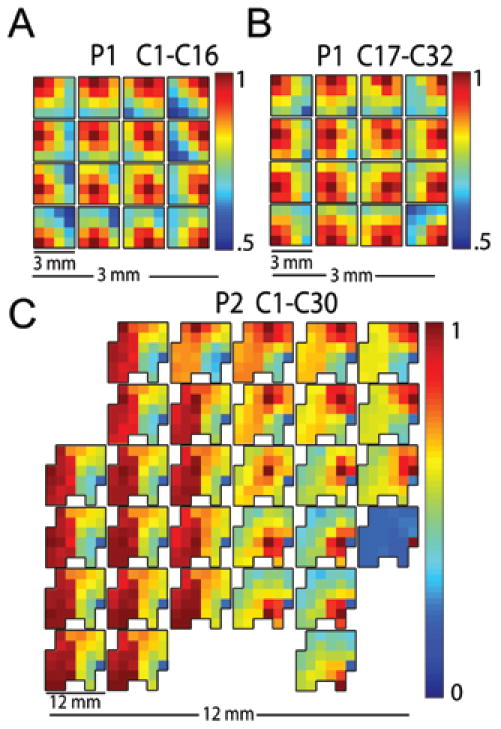
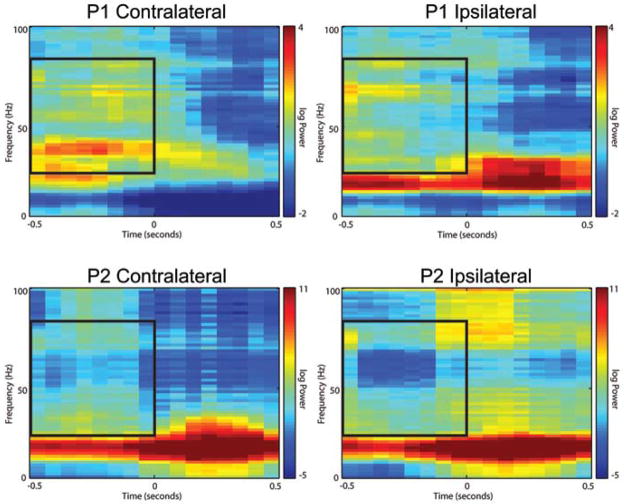
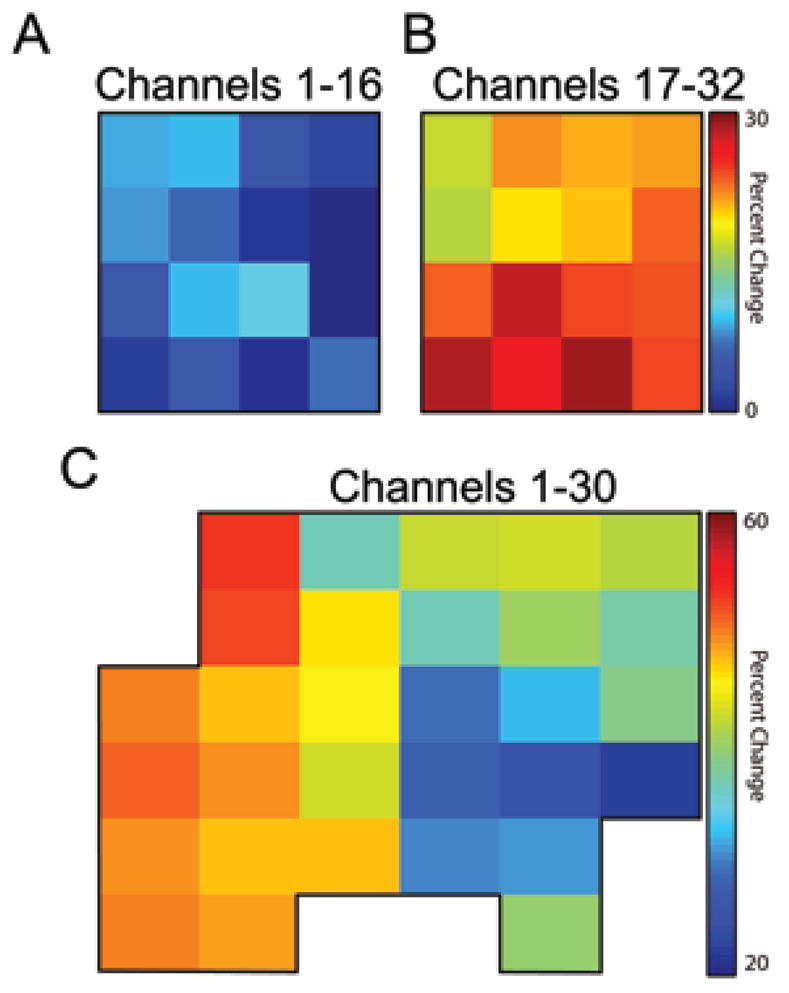
Results: Correlation analysis revealed decreasing signal correlation with distance. The gamma-band power during motor planning allowed binary classification of gross directionality in the reaching movements. The degree of power change was correlated to the underlying gyral pattern.

Conclusions: The nonpenetrating microwire platform showed good potential for allowing differentiated signals to be recorded with high spatial fidelity without cortical penetration.


Figures

Fig. 1
Fig. 1
Photographs showing device implantation in the patients in Cases 1 and 2. Left: Two nonpenetrating microwire arrays (1-mm spacing) were implanted over the right primary motor cortex in the first patient. Channels 1–16 are over the hand area (orange wire), and channels 17–32 are over the arm area (green wire). Right: A single 30-channel array (2-mm spacing) was implanted over the left primary motor cortex hand and arm area in the second patient.
Fig. 2
Fig. 2
Trial detection and filtering for a portion of recorded motor tasks including continuous movement, velocity profiles, and filtering of horizontal and vertical components. A: An overlay of computer mouse x and y positions with the starting position and reach targets. Patients were instructed to move a computer mouse from the starting position (bottom center) to either the upper left or upper right corners of a computerized tablet, then return to the starting position. The target of each sequence was relayed verbally as a cue to begin movement. Movement sequences (outward reach and return) typically lasted 2–3 seconds with a brief pause at the target; however, only data recorded during outward reaching movement were used for analysis. Trials were marked by evaluating times at which velocity crossed a threshold. B: Overlaid velocity profiles of trials in the up-left direction. C: Filtering of the vertical component of movement for each trial in the up-left direction. D: Filtering of the horizontal component of movement for each trial in the up-left direction. In both the vertical and horizontal cases, the thick dark lines indicate a single SD away from the average path. To be retained for further analysis, a trial must be ≥ 80% within the boundaries in both the horizontal and vertical components of movement. Retained trials are shown in green; discarded trials are shown in dashed red. Overall, 55% of trials in the patient in Case 1 and 56% of trials in Case 2 were retained for analysis.
Fig. 3
Fig. 3
Gamma band (30–80 Hz) pairwise cross-correlations between each nonpenetrating microwire and all other microwires within an array. A: Array correlation, channels 1–16 (orange wire in Fig. 1) in the patient in Case 1 (P1). B: Array correlation in Case 1, channels 17–32 (green wire in Fig. 1.). C: Array correlation, 30 channels obtained in the patient in Case 2 (P2). The physical layouts of the devices in this figure are shown at 2 scales. At each location in the array, a miniature replica of the entire array indicates the pairwise cross-correlation of that nonpenetrating microwire with all other microwires in the array. The location itself is identifiable in the miniature replica by the dark red pixel showing the autocorrelation. Both arrays in Case 1 show an inverse relationship between correlation strength and distance. High correlation between microwires in the anterior portion of Case 2, located over the hand area of primary motor cortex, contrasts with the decay seen in the posterior portion, which rested over the parietal cortex. The variation evident in correlation strength across arrays suggests that nonpenetrating microwire arrays can capture higher spatial resolution detail of neuronal signals than standard 5-mm-diameter ECoG electrodes that might rest over the same surface area. Note that the color scale is optimized to visually emphasize the correlation drop across a device.
Fig. 4
Fig. 4
Spectrograms from a single nonpenetrating microwire for each patient demonstrating increased power in the gamma band during the planning phase for movement in the contralateral versus ipsilateral direction. These spectrograms are aligned at the 0-second tick to an outward reach movement. Recorded data from the nonpenetrating microwires were band-pass filtered to 5–150 Hz. Spectrograms were generated using the Chronux routines with a moving window of 250 msec and 50-msec step size; additionally, spectrograms were normalized to the average spectrum across time within the 1-sec window as described in the Methods section. Movement in the left column is toward the target contralateral to hemisphere in which the array was implanted; movement in the right column is toward the ipsilateral direction. Inlaid boxed area represents an outline of the gamma band for the planning stage evaluated in Fig. 7. Although only a single electrode is shown, the results are representative of most electrodes on each array.
Fig. 5
Fig. 5
Spectrograms from all nonpenetrating microwires in the first patient (P1) demonstrating increased power in the gamma band during the planning phase for movement in the contralateral versus ipsilateral direction. Spectrograms were generated as described in the Methods section and the legend to Fig. 4. Upper panels show spectral content for movement toward the target contralateral to implantation hemisphere, and lower panels represent movement in the ipsilateral direction.
Fig. 6
Fig. 6
Spectrograms from all nonpenetrating microwires in the second patient (P2) demonstrating increased power in the gamma band during the planning phase for movement in the contralateral versus the ipsilateral direction. Spectrograms were generated as described in the Methods section and the legend to Fig. 4. Upper panels show spectral content for movement toward the target contralateral to implantation hemisphere; the lower panels represent movement toward the ipsilateral direction.
Fig. 7
Fig. 7
Plots showing, for each nonpenetrating microwire channel in each patient, the percent change in average gamma-band power during planning for movement in the contralateral direction over movement in the ipsilateral direction. After generating spectrograms for each channel as shown in Fig. 4, values for frequencies between 30 and 80 Hz and the full 500 msec before movement were averaged to a single value representative of the power over the entire gamma band during the movement planning phase. The difference between these mean values, normalized to the contralaterally directed mean values, is shown. In A and B, the percent change between contralaterally and ipsilaterally directed movement is shown for both electrode arrays implanted in the patient in Case 1. The disparity in magnitude of percent change between arrays is indicative of the underlying structure: channels 17–32 were located over the upper extremity primary motor cortex, whereas channels 1–16 were located more inferiorly along the precentral gyrus. In C, the percent change between the contralateral and ipsilateral direction is shown for all 30 channels in the second patient. The patterns evident in C also correspond closely to the underlying anatomy as noted in the Discussion section.

References

    1. Brunner C, Scherer R, Graimann B, Supp G, Pfurtscheller G. Online control of a brain-computer interface using phase synchronization. IEEE Trans Biomed Eng. 2006;53:2501–2506. - PubMed
    1. Georgopoulos AP, Merchant H, Naselaris T, Amirikian B. Mapping of the preferred direction in the motor cortex. Proc Natl Acad Sci U S A. 2007;104:11068–11072. - PMC - PubMed
    1. Hochberg LR, Serruya MD, Friehs GM, Mukand JA, Saleh M, Caplan AH, et al. Neuronal ensemble control of prosthetic devices by a human with tetraplegia. Nature. 2006;442:164–171. - PubMed
    1. Kennedy PR, Bakay RA, Moore MM, Adams K, Goldwaithe J. Direct control of a computer from the human central nervous system. IEEE Trans Rehabil Eng. 2000;8:198–202. - PubMed
    1. Leuthardt EC, Schalk G, Wolpaw JR, Ojemann JG, Moran DW. A brain-computer interface using electrocorticographic signals in humans. J Neural Eng. 2004;1:63–71. - PubMed

Publication types