The role of pre-emptive culling in the control of foot-and-mouth disease
- PMID: 19570791
- PMCID: PMC2817163
- DOI: 10.1098/rspb.2009.0427
The role of pre-emptive culling in the control of foot-and-mouth disease
Abstract
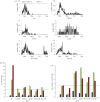
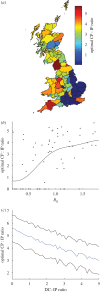
The 2001 foot-and-mouth disease epidemic was controlled by culling of infectious premises and pre-emptive culling intended to limit the spread of disease. Of the control strategies adopted, routine culling of farms that were contiguous to infected premises caused the most controversy. Here we perform a retrospective analysis of the culling of contiguous premises as performed in 2001 and a simulation study of the effects of this policy on reducing the number of farms affected by disease. Our simulation results support previous studies and show that a national policy of contiguous premises (CPs) culling leads to fewer farms losing livestock. The optimal national policy for controlling the 2001 epidemic is found to be the targeting of all contiguous premises, whereas for localized outbreaks in high animal density regions, more extensive fixed radius ring culling is optimal. Analysis of the 2001 data suggests that the lowest-risk CPs were generally prioritized for culling, however, even in this case, the policy is predicted to be effective. A sensitivity analysis and the development of a spatially heterogeneous policy show that the optimal culling level depends upon the basic reproductive ratio of the infection and the width of the dispersal kernel. These analyses highlight an important and probably quite general result: optimal control is highly dependent upon the distance over which the pathogen can be transmitted, the transmission rate of infection and local demography where the disease is introduced.
Figures


Similar articles
-
Modeling the spread and control of foot-and-mouth disease in Pennsylvania following its discovery and options for control.Prev Vet Med. 2012 May 1;104(3-4):224-39. doi: 10.1016/j.prevetmed.2011.11.007. Epub 2011 Dec 12. Prev Vet Med. 2012. PMID: 22169708 Free PMC article.
-
Options for managing animal welfare on intensive pig farms confined by movement restrictions during an outbreak of foot and mouth disease.Prev Vet Med. 2014 Dec 1;117(3-4):533-41. doi: 10.1016/j.prevetmed.2014.10.002. Epub 2014 Oct 12. Prev Vet Med. 2014. PMID: 25457134
-
The impact of local heterogeneity on alternative control strategies for foot-and-mouth disease.Proc Biol Sci. 2003 Dec 22;270(1533):2557-64. doi: 10.1098/rspb.2003.2546. Proc Biol Sci. 2003. PMID: 14728777 Free PMC article.
-
Destructive tension: mathematics versus experience--the progress and control of the 2001 foot and mouth disease epidemic in Great Britain.Rev Sci Tech. 2011 Aug;30(2):483-98. doi: 10.20506/rst.30.2.2054. Rev Sci Tech. 2011. PMID: 21961220 Review.
-
Foot-and-Mouth disease control using vaccination: the Dutch experience in 2001.Dev Biol (Basel). 2004;119:41-9. Dev Biol (Basel). 2004. PMID: 15742617 Review.
Cited by
-
Spatial scaling relationships for spread of disease caused by a wind-dispersed plant pathogen.Ecosphere. 2012 Mar 9;3(3):art24. doi: 10.1890/ES11-00281.1. Ecosphere. 2012. PMID: 24077925 Free PMC article.
-
Challenges to the Application of Spatially Explicit Stochastic Simulation Models for Foot-and-Mouth Disease Control in Endemic Settings: A Systematic Review.Comput Math Methods Med. 2020 Nov 21;2020:7841941. doi: 10.1155/2020/7841941. eCollection 2020. Comput Math Methods Med. 2020. PMID: 33294003 Free PMC article.
-
Modelling the Spread of Foot and Mouth Disease in Different Livestock Settings in Italy to Assess the Cost Effectiveness of Potential Control Strategies.Animals (Basel). 2025 Jan 29;15(3):386. doi: 10.3390/ani15030386. Animals (Basel). 2025. PMID: 39943156 Free PMC article.
-
Evaluation of strategies using simulation model to control a potential outbreak of highly pathogenic avian influenza among poultry farms in Central Luzon, Philippines.PLoS One. 2020 Sep 10;15(9):e0238815. doi: 10.1371/journal.pone.0238815. eCollection 2020. PLoS One. 2020. PMID: 32913363 Free PMC article.
-
The evolution of parasite virulence under targeted culling and harvesting in wildlife and livestock.Evol Appl. 2023 Sep 28;16(10):1697-1707. doi: 10.1111/eva.13594. eCollection 2023 Oct. Evol Appl. 2023. PMID: 38020874 Free PMC article.
References
-
- Anderson I.2002Foot and mouth disease 2001: lessons to be learned enquiry. London, UK: The Stationary Office
-
- Boender G. J., Hagenaars T. J., Bouma A., Nodelijk G., Elbers A. R., de Jong M. C., Van Boven M.2007Risk maps for the spread of highly pathogenic avian influenza in poultry. PLoS Comput Biol. 3, E71 (doi:10.1371/journal.pcbi.0030071) - DOI - PMC - PubMed
-
- Chis Ster I., Singh B., Ferguson N. M.2009Epidemiological inference for partially observed epidemics: the example of the 2001 foot and mouth epidemic in Great Britain. Epidemics 1, 21–34 (doi:10.1016/j.epidem.2008.09.001) - DOI - PubMed
Publication types
MeSH terms
Grants and funding
LinkOut - more resources
Full Text Sources

