. 2009 Jul 15;183(2):1384-92.
doi: 10.4049/jimmunol.0803987. Epub 2009 Jul 1.

Ubiquitin-editing enzyme A20 promotes tolerance to lipopolysaccharide in enterocytes

Affiliations

Ubiquitin-editing enzyme A20 promotes tolerance to lipopolysaccharide in enterocytes

Jin Wang et al. J Immunol. .

Abstract

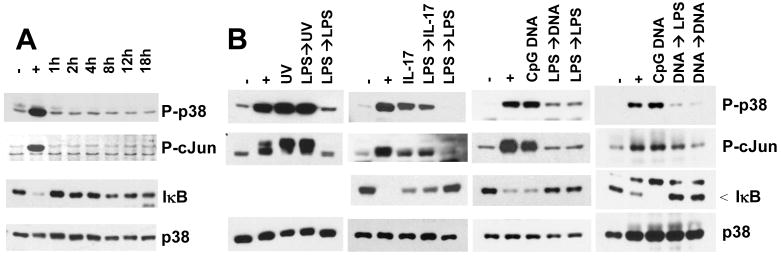
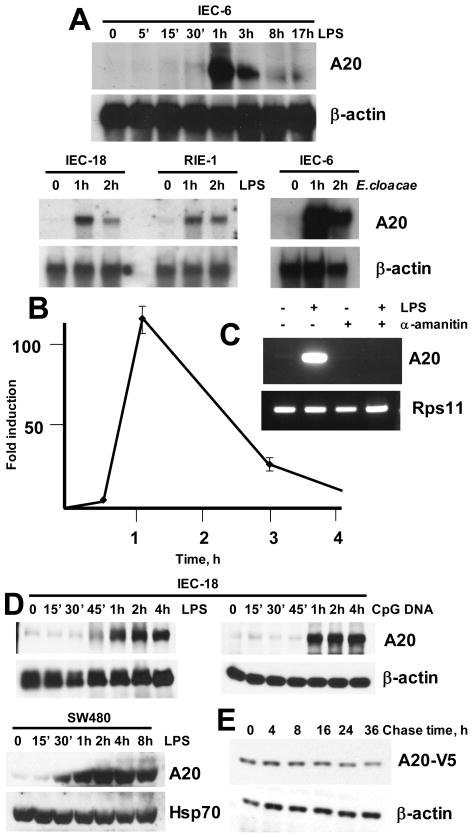
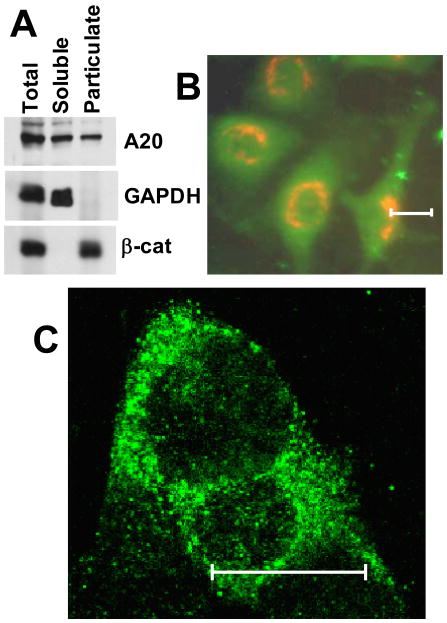
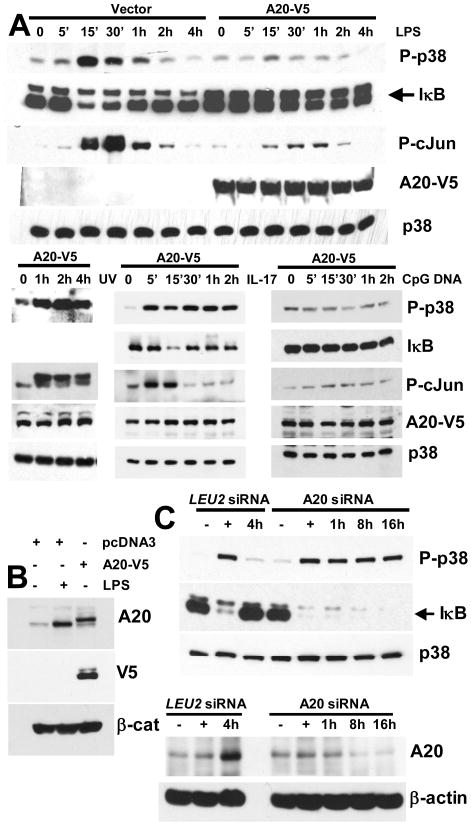
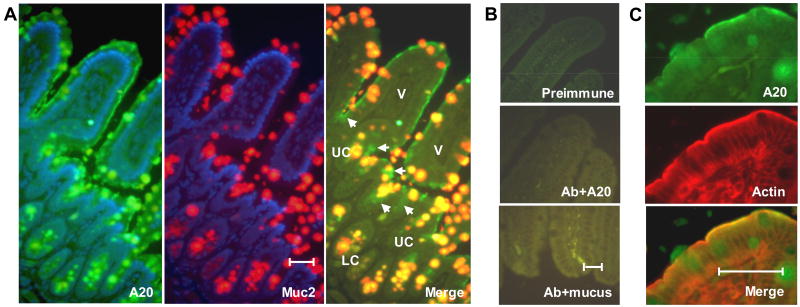
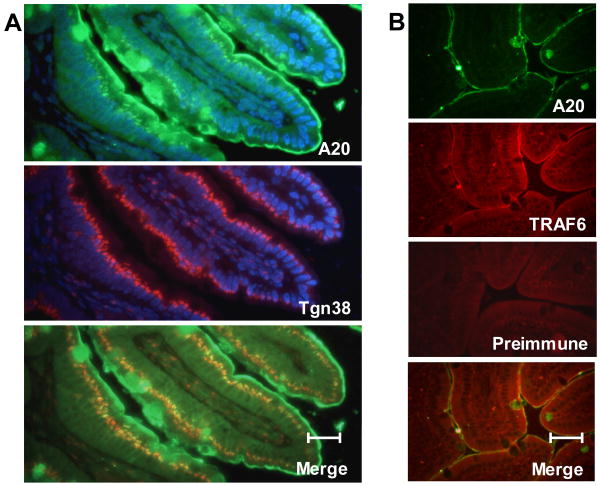
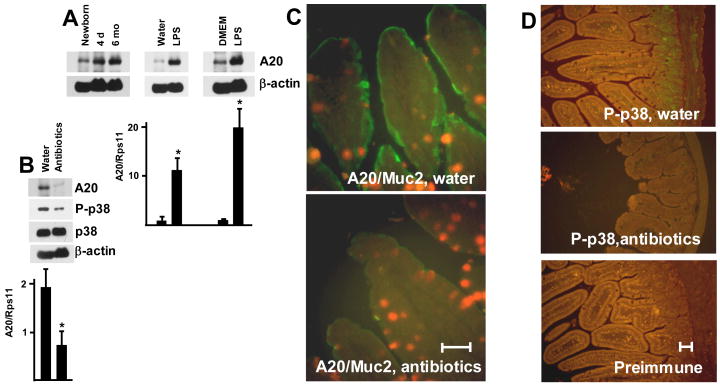
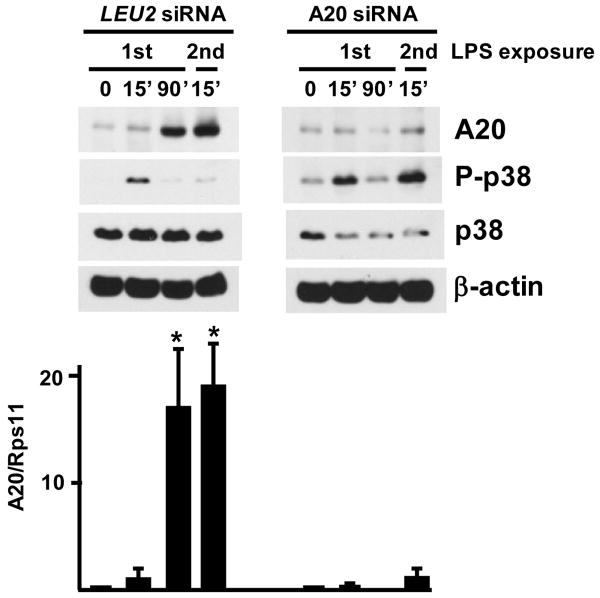
Although enterocytes are capable of innate immune responses, the intestinal epithelium is normally tolerant to commensal bacteria. To elucidate the mechanisms of tolerance, we examined the effect of preexposure to LPS on activation of p38, c-Jun, and NF-kappaB in enterocytes by several inflammatory and stress stimuli. Shortly after the initial LPS challenge, enterocytes become tolerant to restimulation with LPS or CpG DNA, but not with IL-17 or UV. The state of tolerance, which lasts 20-26 h, temporally coincides with LPS-induced expression of the anti-inflammatory ubiquitin-editing enzyme A20. Small interfering RNA silencing of A20 prevents tolerance, whereas ectopic expression of A20 blocks responses to LPS and CpG DNA, but not to IL-17 or UV. A20 levels in the epithelium of the small intestine are low at birth and following gut decontamination with antibiotics, but high under conditions of bacterial colonization. In the small intestine of adult rodents, A20 prominently localizes to the luminal interface of villus enterocytes. Lower parts of the crypts display relatively low levels of A20, but relatively high levels of phospho-p38. Gut decontamination with antibiotics reduces the levels of both A20 and phospho-p38. Along with the fact that A20-deficient mice develop severe intestinal inflammation, our results indicate that induction of A20 plays a key role in the tolerance of the intestinal epithelium to TLR ligands and bacteria.


Conflict of interest statement

Disclosures: The authors have no financial conflict of interest.

Figures

Figure 1
Figure 1
Tolerance to LPS-induced phosphorylation of p38 in enterocyte cell lines. Phosphorylation of p38 in subconfluent IEC-6, IEC-18, RIE-1, and SW480 cells (A), and in confluent, stationary IEC-6 cells (B) pre-treated with 1 μg/ml LPS for 15 min, incubated in LPS-free medium for indicated time, and re-stimulated with LPS for 15 min. -, untreated cells; +, cells treated with LPS once for 15 min. Data are representative of at least 3 independent experiments.
Figure 2
Figure 2
Effect of pre-treatment with LPS on inflammatory signaling. A, Levels of phospho-p38, phospho-cJun, and IkB in IEC-6 cells pre-treated with 1 μg/ml LPS for 15 min, incubated in LPS-free medium for indicated time, and re-stimulated with LPS for 15 min. B, Activation of p38, c-Jun, and NF-kB in IEC-6 cells pre-treated with LPS or CpG DNA for 15 min, incubated in LPS-free medium for 4 h, and treated with 50 mJ/cm2 UVC followed by incubation in growth medium for 1 h, or 100 ng/ml IL-17 for 15 min, or 20 μg/ml CpG DNA for 15 min, or LPS for 15 min, as indicated. -, untreated cells; +, cells treated with LPS once for 15 min. Arrowhead indicates specific IkB bands; the band above IkB is due to non-specific immunoreactivity of a particular batch of IkB Ab. Data are representative of at least 3 independent experiments.
Figure 3
Figure 3
Time course of A20 mRNA and protein induction. A, A20 and β-actin mRNA levels in enterocytes treated with 1 μg/ml LPS or 107 CFU/ml E. cloacae for indicated time. B, Time course of A20 mRNA induction in IEC-6 cells by LPS; average data from 3 Northern blots. C, A20 RT-PCR after 1 h stimulation of IEC-6 cells with LPS, with or without 30 min pre-treatment with 10 μg/ml α-amanitin. D, Western blot for the time course of LPS- or CpG DNA-induced A20 protein expression. E, Levels of A20-V5 protein in IEC-6 cells stably transfected with pcDNA3.1-A20 and treated with 10 μM cycloheximide for indicated time. β-actin and Hsp70 blots are shown to demonstrate equal lane load. Data in D and E are representative of at least 3 independent experiments.
Figure 4
Figure 4
Localization of A20 in IEC-6 cells. A, Distribution of A20 protein between soluble and particulate fractions in a homogenate of IEC-6 cells treated with LPS for 2 h. Also shown is distribution of a typical soluble (glyceraldehyde phosphate dehydrogenase) and a membrane-associated (β-catenin) proteins. B, Two-color IF for A20 (green) and Tgn38 (red) in IEC-6 cells treated with LPS for 2 h. C, Confocal image of A20 IF across mid-section of IEC-6 cells treated with LPS for 2 h. Bar, 10 μM. All data are representative of at least 3 independent experiments.
Figure 5
Figure 5
A20 is necessary and sufficient for the development of tolerance to LPS in IEC-6 cells. A, Levels of phospho-p38, IkB, and phospho-c-Jun in cells stably transfected with pcDNA3.1-V5His or pcDNA3-A20 and treated with LPS, UV, IL-17, or CpG DNA for indicated time. B, Levels of A20 protein in IEC-6 cells transfected with pcDNA3.1-V5His or pcDNA3-A20 and treated with or without LPS, as indicated. A20-V5 has slightly lower electromobility than native A20 due to added C-terminal sequence (His6 and V5 tags + spacers). C, Levels of phospho-p38, IkB, and A20 in IEC-6 cells transfected with LEU2 or A20 siRNAs and treated with LPS for 15 min, incubated in LPS-free medium for indicated time, and re-challenged with LPS for 15 min. Arrows indicate position of IkB bands; the band above IkB is due to non-specific immunoreactivity of a particular batch of IkB Ab. - and +, naive transfectants treated without and with LPS, respectively, for 15 min. Data are representative of at least 3 independent experiments.
Figure 6
Figure 6
Localization of A20 in the small intestine. A, Immunostaining of ileal section of a conventionally housed adult mouse with A20 Ab (left), Muc2 Ab (middle) and merged image (right). DAPI-stained nuclei appear in blue in the first two panels; nuclear staining is not shown on the merged image. V, villi; UC, upper parts of the crypts; LC, lower parts of the crypts. Arrowheads indicate diffuse A20 localization in the epithelium of upper parts of the crypts and crypt openings. B, Abrogation of specific immunofluorescence by substitution of the primary Ab with pre-immune chicken serum (top), or pre-incubation of A20 Ab (20 μg/ml) with affinity-purified A20 protein (200 μg/ml, right) or purified mucus (200 μg/ml protein, right) for 30 min at room temperature. C, Two-color IF for A20 (green) and actin (red). Bar, 100 μM. All images are representative of tissue samples from at least 3 different animals.
Figure 7
Figure 7
Co-localization of A20 with a Golgi marker protein and TRAF6 in the villus epithelium. A, Two-color IF for A20 (green) and Tgn38 (red). DAPI-stained nuclei appear in blue in the top and middle panels. The A20 image was taken at relatively high exposure to reveal Golgi staining, which is significantly weaker than apical sub-membrane staining. B, Two-color IF for A20 (green) and TRAF6 (red). Mock staining with pre-immune rabbit serum is shown to demonstrate the specificity of TRAF6 IF. The A20 image was underexposed to show that A20 signal is strongest in the apical sub-membrane. Bar, 100 μM. All images are representative of tissue samples from at least 3 different animals.
Figure 8
Figure 8
Effect of age and antibiotic treatment on levels of A20 and phospho-p38. A, A20 protein in ileal mucosal scrapings from newborn, 4 day old, and 6 mo old rats (left); A20 protein (middle top) and A20/Rps11 mRNA ratios (middle bottom) in ileal mucosal scrapings from newborn rats gavaged with 200 μl of sterile water or 1 μg/ml LPS and sacrificed 2 h later; A20 protein (right top) and A20/Rps11 mRNA ratios (right bottom) in ileal mucosal scrapings obtained from a newborn rat immediately after birth and incubated in DMEM or DMEM + 1 μg/ml LPS for 1 h. B, A20, phospho-p38, and p38 (top) and A20/Rps11 mRNA ratios (bottom) in ileal mucosal scrapings from a conventionally housed mouse that received regular drinking water and a mouse kept in a specific pathogen-free environment with antibiotics in drinking water. β-actin blots are shown to demonstrate equal lane load. *, significant differences compared to control samples. C, Two-color IF for A20 (green) and Muc2 (red) in the ileum of a conventionally housed mouse that received regular drinking water (left) and a mouse kept in a specific pathogen-free environment with antibiotics in drinking water (right). D, Phospho-p38 IF (green) in the ileal sections of mice treated as in C (left, middle); control staining of a section from the conventionally housed mouse with pre-immune rabbit serum (right). To distinguish between autofluorescence and relatively weak phospho-p38 signal, an additional image was taken in red (nonspecific) channel and merged with the image in green channel; on the merged images shown, autofluorescense appears in yellow-brown hues, whereas phospho-p38 IF appears in green. Bar, 100 μm. Data are representative of at least 3 different animals in each group.
Figure 9
Figure 9
A20 expression is necessary for the establishment of tolerance to LPS in the epithelium of the small intestine ex vivo. Mucosal scrapings obtained from the whole small intestine of a full term rat fetus were transfected with 1 μg/ml of LEU2 or A20 siRNAs for 30 min (1st LPS exposure, 0 time point), followed by 15 min treatment with 1 μg/ml LPS (1st LPS exposure, 15′), 3 washes with DMEM, 75 min incubation in LPS-free medium (1st LPS exposure, 90′), and second 15 min treatment with LPS (2nd LPS exposure). Levels of A20, phospho-p38, p38, β-actin proteins (top), and A20/Rps11 mRNA ratios (bottom) were determined by Western blotting and real time RT-PCR. Western blot data are representative of 3 animals in each transfection group. *, significant differences compared to all unmarked samples.

Similar articles

Cited by

References

    1. Fukata M, Abreu MT. TLR4 signalling in the intestine in health and disease. Biochem Soc Trans. 2007;35:1473–1478. - PubMed
    1. Lee J, Mo JH, Shen C, Rucker AN, Raz E. Toll-like receptor signaling in intestinal epithelial cells contributes to colonic homoeostasis. Curr Opin Gastroenterol. 2007;23:27–31. - PubMed
    1. Michelsen KS, Arditi M. Toll-like receptors and innate immunity in gut homeostasis and pathology. Curr Opin Hematol. 2007;14:48–54. - PubMed
    1. Rakoff-Nahoum S, Medzhitov R. Role of the innate immune system and host-commensal mutualism. Curr Top Microbiol Immunol. 2006;308:1–18. - PubMed
    1. Sanderson IR, Walker WA. TLRs in the Gut I. The role of TLRs/Nods in intestinal development and homeostasis. Am J Physiol Gastrointest Liver Physiol. 2007;292:G6–10. - PMC - PubMed

Publication types

MeSH terms

Substances