. 2009 Jul;37(13):4181-93.
doi: 10.1093/nar/gkp552. Epub 2009 Jul 1.

Single nucleotide polymorphism arrays: a decade of biological, computational and technological advances

Affiliations

Single nucleotide polymorphism arrays: a decade of biological, computational and technological advances

Thomas LaFramboise. Nucleic Acids Res. 2009 Jul.

Abstract

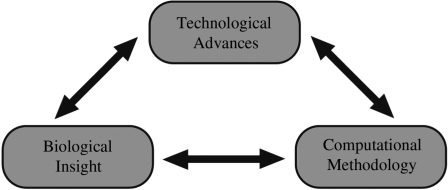
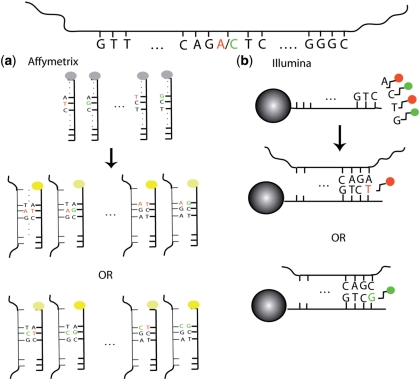
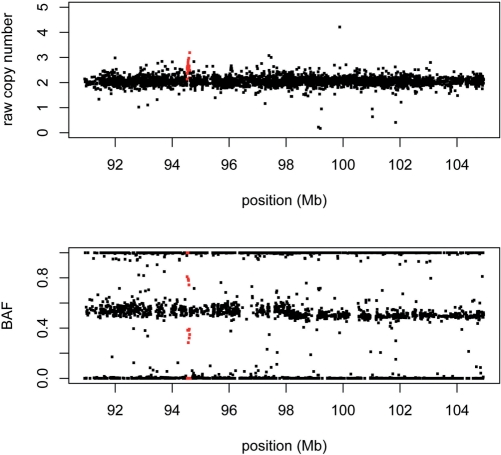
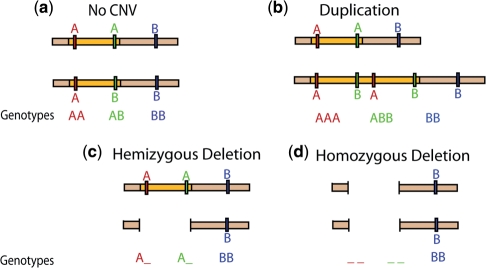
Array manufacturers originally designed single nucleotide polymorphism (SNP) arrays to genotype human DNA at thousands of SNPs across the genome simultaneously. In the decade since their initial development, the platform's applications have expanded to include the detection and characterization of copy number variation--whether somatic, inherited, or de novo--as well as loss-of-heterozygosity in cancer cells. The technology's impressive contributions to insights in population and molecular genetics have been fueled by advances in computational methodology, and indeed these insights and methodologies have spurred developments in the arrays themselves. This review describes the most commonly used SNP array platforms, surveys the computational methodologies used to convert the raw data into inferences at the DNA level, and details the broad range of applications. Although the long-term future of SNP arrays is unclear, cost considerations ensure their relevance for at least the next several years. Even as emerging technologies seem poised to take over for at least some applications, researchers working with these new sources of data are adopting the computational approaches originally developed for SNP arrays.


Figures

Figure 1.
Figure 1.
Synergy between computational methodology, biological inferences and technology. This review aims to showcase SNP arrays at the center of a dynamic synergy across these three fields, each helping to drive advances in the others.
Figure 2.
Figure 2.
Overview of SNP array technology. At the top is the fragment of DNA harboring an A/C SNP to be interrogated by the probes shown. (a) In the Affymetrix assay, there are 25-mer probes for both alleles, and the location of the SNP locus varies from probe to probe. The DNA binds to both probes regardless of the allele it carries, but it does so more efficiently when it is complementary to all 25 bases (bright yellow) rather than mismatching the SNP site (dimmer yellow). This impeded binding manifests itself in a dimmer signal. (b) Attached to each Illumina bead is a 50-mer sequence complementary to the sequence adjacent to the SNP site. The single-base extension (T or G) that is complementary to the allele carried by the DNA (A or C, respectively) then binds and results in the appropriately-colored signal (red or green, respectively). For both platforms, the computational algorithms convert the raw signals into inferences regarding the presence or absence of each of the two alleles.
Figure 3.
Figure 3.
Two sources of information from SNP arrays. The raw copy number (top panel) and BAF (bottom panel) are plotted for a 14 Mb region on chromosome 9. Both views of the data, from a custom Illumina array, provide evidence for a focal gain (in red). Note that the gain manifests itself in the BAF plot as clusters of points intermediary between 0.5 and 0 or 1, as expected from the values in Table 1.
Figure 4.
Figure 4.
SNP genotypes in the presence of CNVs. (a) Traditional SNP genotyping, under the assumption of two copies. (b) A chromosome harbors a duplication of the orange region, resulting in multi-allelic genotypes for the two SNPs contained in the region. (c) A chromosome harbors a deletion of the orange region. (d) This individual carries a deletion of the orange region on both chromosomes, resulting in _ _ genotypes for the two SNPs.
Figure 5.
Figure 5.
Calling SNP/CNV alleles from raw data. All three SNPs shown here on chromosome 21 have alleles A and G. All plots show A allele and G allele intensity values from Illumina HumanHap550 data for 112 HapMap samples. The top three panels show each of the three SNPs individually along with their generalized genotypes. The bottom panel shows the total raw copy number sums (A signal + G signal) plotted, with each axis representing one of the SNPs. Note that the samples clearly separate into homozygous deletions (red), hemizygous deletions (blue), and normal (green).

Similar articles

Cited by

References

    1. Kruglyak L, Nickerson DA. Variation is the spice of life. Nat. Genet. 2001;27:234–236. - PubMed
    1. Sebat J, Lakshmi B, Troge J, Alexander J, Young J, Lundin P, Månér S, Massa H, Walker M, Chi M, et al. Large-scale copy number polymorphism in the human genome. Science. 2004;305:525–528. - PubMed
    1. Iafrate AJ, Feuk L, Rivera MN, Listewnik ML, Donahoe PK, Qi Y, Scherer SW, Lee C. Detection of large-scale variation in the human genome. Nat. Genet. 2004;36:949–951. - PubMed
    1. Feuk L, Carson AR, Scherer SW. Structural variation in the human genome. Nat. Rev. Genetics. 2006;7:85–97. - PubMed
    1. Rovelet-Lecrux A, Hannequin D, Raux G, Le Meur N, Laquerrière A, Vital A, Dumanchin C, Feuillette S, Brice A, Vercelletto M, et al. APP locus duplication causes autosomal dominant early-onset alzheimer disease with cerebral amyloid angiopathy. Nat. Genet. 2006;38:24–26. - PubMed

Publication types