. 2009 Sep;83(18):9432-48.
doi: 10.1128/JVI.00739-09. Epub 2009 Jul 1.

Subcellular localization of the barley stripe mosaic virus triple gene block proteins

Affiliations

Subcellular localization of the barley stripe mosaic virus triple gene block proteins

Hyoun-Sub Lim et al. J Virol. 2009 Sep.

Erratum in

  • J Virol. 2009 Nov;83(21):11413

Abstract

Barley stripe mosaic virus (BSMV) spreads from cell to cell through the coordinated actions of three triple gene block (TGB) proteins (TGB1, TGB2, and TGB3) arranged in overlapping open reading frames (ORFs). Our previous studies (D. M. Lawrence and A. O. Jackson, J. Virol. 75:8712-8723, 2001; D. M. Lawrence and A. O. Jackson, Mol. Plant Pathol. 2:65-75, 2001) have shown that each of these proteins is required for cell-to-cell movement in monocot and dicot hosts. We recently found (H.-S. Lim, J. N. Bragg, U. Ganesan, D. M. Lawrence, J. Yu, M. Isogai, J. Hammond, and A. O. Jackson, J. Virol. 82:4991-5006, 2008) that TGB1 engages in homologous interactions leading to the formation of a ribonucleoprotein complex containing viral genomic and messenger RNAs, and we have also demonstrated that TGB3 functions in heterologous interactions with TGB1 and TGB2. We have now used Agrobacterium tumefaciens-mediated protein expression in Nicotiana benthamiana leaf cells and site-specific mutagenesis to determine how TGB protein interactions influence their subcellular localization and virus spread. Confocal microscopy revealed that the TGB3 protein localizes at the cell wall (CW) in close association with plasmodesmata and that the deletion or mutagenesis of a single amino acid at the immediate C terminus can affect CW targeting. TGB3 also directed the localization of TGB2 from the endoplasmic reticulum to the CW, and this targeting was shown to be dependent on interactions between the TGB2 and TGB3 proteins. The optimal localization of the TGB1 protein at the CW also required TGB2 and TGB3 interactions, but in this context, site-specific TGB1 helicase motif mutants varied in their localization patterns. The results suggest that the ability of TGB1 to engage in homologous binding interactions is not essential for targeting to the CW. However, the relative expression levels of TGB2 and TGB3 influenced the cytosolic and CW distributions of TGB1 and TGB2. Moreover, in both cases, localization at the CW was optimal at the 10:1 TGB2-to-TGB3 ratios occurring in virus infections, and mutations reducing CW localization had corresponding effects on BSMV movement phenotypes. These data support a model whereby TGB protein interactions function in the subcellular targeting of movement protein complexes and the ability of BSMV to move from cell to cell.


Figures

FIG. 1.
FIG. 1.
Analysis of DsRed-TGB3 localization in agroinfiltrated N. benthamiana leaf cells. (A) Paired fluorescent foci of DsRed-TGB3 in unplasmolyzed epidermal leaf cells. (B) Cells coexpressing DsRed-TGB3 and GFP-talin as a cell membrane marker. (C) Fluorescence of DsRed-TGB3 in plasmolyzed leaf tissue containing GFP-talin. (D) Magnified image of DsRed-TGB3 in plasmolyzed tissue. (E) Tissue infiltrated with bacteria harboring the TMV P30-GFP (P30:GFP) plasmid to serve as a CW marker. (F) DsRed-TGB3 and TMV P30-GFP fluorescence in cells. (G and H) DsRed-TGB3 and P30-GFP coexpression in plasmolyzed leaf tissue. Note that plasmids were expressed in N. benthamiana leaves via agroinfiltration, and laser scanning confocal microscopy images of epidermal leaf cells were captured at 2 to 3 days after infiltration. Plasmolysis was carried out by infiltrating leaf sections with 700 mM sucrose before microscopic examination of tissue, and calcofluor blue CW staining was digitally manipulated to appear white. Arrows in the images identify the locations of magnified inset panels that highlight protein localization. Bars, 50 μm.
FIG. 2.
FIG. 2.
Subcellular localization of TGB3 mutants. (A, D, and G) Appearance of cells in tissue infiltrated with Agrobacterium isolates harboring DsRed-TGB3 plasmid derivatives. Epifluorescent images are overlaid onto DIC images. (B, E, and H) Plasmolyzed cells in tissue expressing DsRed-TGB3 derivatives and GFP-talin. (C, F, and I) Plasmolyzed leaf cells coinfiltrated with DsRed-TGB3 derivatives and P30-GFP. (A to C) Paired CW foci formed after infiltration with the DsRed-TGB316-155 mutant, which lacks the first 15 N-terminal amino acids. (D to F) Cells expressing DsRed-TGB31-150, which has a truncation of the five C-terminal amino acids. (G to I) Tissue infiltrated with bacteria containing the DsRed-TGB316-150 TGB3 mutant with deletions of the first 15 N-terminal and the last 5 C-terminal amino acids. Note that the cartoons on the right illustrate the three TGB3 deletion mutants and highlight the deleted sequences. Bars, 20 μm.
FIG. 3.
FIG. 3.
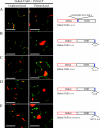
Effects of DsRed-TGB3 deletions and amino acid substitutions on CW localization. Shown are appearances of leaf cells coexpressing TGB3 mutants and P30-GFP. (A) DsRed-TGB316-155; (B) DsRed-TGB31-154; (C) DsRed-TGB3R155A; (D) DsRed-TGB31-153; (E) DsRed-TGB3K154A,R155A. The DsRed-TGB3 mutants with altered sequences are illustrated in the cartoon to the right of the images. Plasmolyzed and unplasmolyzed cells are indicated above the respective panels. Bars, 20 μm.
FIG. 4.
FIG. 4.
Localization of the GFP-TGB2 fusion protein. Proteins were expressed in N. benthamiana leaves by agroinfiltration, and confocal images of epidermal cells were captured 2 to 3 days postinfiltration. (A) GFP-TGB2 (G:TGB2) network pattern and ER patterns in plants transformed with G-KDEL. (B) Plasmolyzed cells infiltrated with GFP-TGB2. (C) Paired foci formed in cells of leaf tissue infiltrated with separate plasmids for GFP-TGB2 and TGB3 designed to provide approximately equal amounts of GFP-TGB2 and TGB3. (D) CW foci after plasmolysis of leaves expressing GFP-TGB2 and TGB3. (E) Fluorescence patterns in leaves expressing the GFP-TGB2/3 plasmid to obtain ∼10:1 ratios of TGB2 to TGB3. (F) Cells from plasmolyzed leaf tissue expressing GFP-TGB2/3. (G) Fluorescence of mutant GFP-TGB2G40R,P41R/3. Note that the TGB2G40R,P41R mutation interferes with the heterologous binding of TGB2 to TGB3. (H) Plasmolyzed cells from leaves infiltrated with the GFP-TGB2G40R,P41R/3 plasmid. (I) GFP-TGB2/3P105R,I108R. Note that the TGB3P105R,I108R mutation disrupts TGB3 binding to TGB2. (J) Plasmolyzed cells in tissue expressing GFP-TGB2/3P105R,I108R. (K) GFP-TGB2/31-150. Note that the TGB31-150 mutation prevents TGB3 binding to the CW. (L) Plasmolyzed cells expressing GFP-TGB2/31-150. Bars, 50 μm.
FIG. 5.
FIG. 5.
TGB3-directed subcellular localization of TGB1. (A) GFP-TGB1-expressing cells showing fluorescent images overlaid onto DIC images. (B) GFP-TGB1 and DsRed-talin fluorescence in plasmolyzed cells. (C) Magnified plasmolyzed cell showing GFP-TGB1 and DsRed-talin fluorescence. (D) Fluorescence of GFP-TGB1 overlaid onto DIC images of cells coexpressing TGB2. (E) Plasmolyzed cells containing GFP-TGB1 and TGB2. (F) Magnified plasmolyzed cells coexpressing GFP-TGB1 and TGB2. (G) DIC images showing GFP-TGB1 fluorescence in cells coexpressing TGB3. (H) Plasmolyzed cell showing GFP-TGB1 fluorescence in the presence of TGB3. (I) Magnified image showing GFP-TGB1 in plasmolyzed cells containing TGB3. (J) DIC images showing localization of GFP-TGB1 in the presence of TGB2/3. (K) Plasmolyzed cells expressing GFP-TGB1 and TGB2/3. (L) Magnified image showing GFP-TGB1 and TGB2/3 in plasmolyzed cells. Bars, 50 μm.
FIG. 6.
FIG. 6.
Subcellular localization of GFP-TGB1 and GFP-TGB2 during expression of various ratios of TGB2 to TGB3. (A) Confocal laser scanning microscopy of plasmolyzed leaf epidermal cells infiltrated with mixtures containing equal amounts of Agrobacterium strains harboring the GFP-TGB1 plasmid and various ratios of strains containing the TGB2 and TGB3 plasmids. DsRed-talin serves as a membrane marker. (Far left) Localization pattern of GFP-TGB1 in the presence of TGB2/3. (Far right) Localization of GFP-TGB1 alone. Ratios of mRNA expression levels of TGB2 to those of TGB3 were estimated by real-time PCR as shown in Table 2. The green rectangle indicates constant levels of GFP-TGB1 mRNA, the green triangle indicates estimated decreases in TGB2 mRNA levels, and the red triangle shows increases in TGB3 mRNA levels. The calculated TGB2-to-TGB3 ratios are indicated below each image. (B) Cells expressing constant levels of GFP-TGB2 with increasing amounts of TGB3 elicited by infiltration mixtures varying between 10:1 and 1:1 as shown in Table 3. The green rectangle indicates constant levels of GFP-TGB2 mRNA, and the red triangle represents increasing levels of TGB3 mRNA. The calculated TGB2-to-TGB3 ratios are designated below each image. The localization of GFP-TGB2 expressed from the GFP-TGB2/3 construct is shown at the far left, and that of GFP-TGB2 is shown at the far right. Note that confocal laser scanning microscopy images of plasmolyzed epidermal cells were captured at 2 days postinfiltration. CWs were stained with calcofluor blue, and DsRed-talin was used to visualize the cytoplasm and membrane fractions. The relative ratios of expression levels of TGB2 and TGB3 mRNAs were estimated by real-time PCR using the 2−ΔΔCT calculation method described in Materials and Methods (Table 3). Each panel shows a 20-μm2 region.
FIG. 7.
FIG. 7.
TGB1 localization in cells coexpressing TGB2 and TGB3 mutant proteins. (A) GFP-TGB1 (G:TGB1) fluorescence during coexpression of TGB2/3 to elicit ∼10:1 ratios of TGB2 to TGB3. (B) TGB2G40R,P41R/3. (C) TGB2/3P105R,I108R. (D) TGB2/31-150. All panels show plasmolyzed cells, and DsRed-talin serves as a cytoplasmic marker. Bars, 50 μm.
FIG. 8.
FIG. 8.
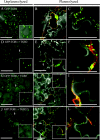
Variable effects of helicase motif mutants on TGB1 targeting. (A) CW-associated fluorescence of wt GFP-TGB1 in unplasmolyzed and plasmolyzed cells coexpressing TGB2/3 and DsRed-talin. (B) GFP-TGB1 M1 mutant localization in cells coexpressing TGB2/3 and DsRed-talin. (C) GFP-TGB1 M7 mutant associations during coexpression with TGB2/3 and DsRed-talin. Note the large spots associated with the plasmolyzed protoplast and the absence of fluorescence at the CW after plasmolysis. Bars, 50 μm.
FIG. 9.
FIG. 9.
Cell-to-cell movement of BSMV derivatives containing TGB3 mutations. N. benthamiana leaves were inoculated with infectious transcripts of BSMV ND18 wt RNAα and RNAγ:γb: GFP to serve as a visual marker to assess localized movement and various RNAβ TGB2/3 mutants. (A) RNAβ wt. (B) TGB3P105R,I108R, which interferes with heterologous interactions of TGB2 and TGB3. (C) TGB31-153, which has a truncation of the last two TGB3 C-terminal residues. (D) TGB3K154A,R155A,with A-residue substitutions for the C-terminal K and R residues. (E) TGB2/3R155A, with an A substitution for the C-terminal R residue. Note that the panel designations refer to RNAβ TGB2/3 derivatives that are expressed in the wt virus context, which results in a ∼10:1 ratio of TGB2 to TGB3. Inoculated leaf samples were maintained in a growth chamber as described in Materials and Methods and photographed at 7 or 10 dpi. Bars, 50 μm.
FIG. 10.
FIG. 10.
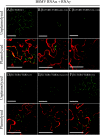
Effects of TGB2 and TGB3 mutations on CW targeting by GFP-TGB1. (A) wt RNAβ-GFP-TGB1. (B) RNAβ-GFP-TGB1 containing the TGB2G40R,P41R mutation to disrupt TGB2 interactions with TGB3. (C) RNAβ-GFP-TGB1 with the TGB3P105,I108R mutation, which disrupts TGB3 interactions with TGB2. (D) RNAβ-GFP-TGB1 harboring the TGB31-153 deletion mutant. (E) RNAβ-GFP-TGB1 containing the TGB3K154A,R155A substitution mutant. (F) RNAβ-GFP-TGB1 with TGB3R155A. Note that N. benthamiana leaves were inoculated with infectious BSMV ND18 RNAα and RNAγ transcripts plus the RNAβ-GFP-TGB1 derivatives specified. Leaves to be plasmolyzed were infiltrated with Agrobacterium cells harboring DsRed-talin at 7 dpi, and the fluorescence of plasmolyzed or unplasmolyzed samples was observed at 9 dpi. Bars, 50 μm.

References

    1. Bae, H., M. S. Kim, R. C. Sicher, H. J. Bae, and B. A. Bailey. 2006. Necrosis- and ethylene-inducing peptide from Fusarium oxysporum induces a complex cascade of transcripts associated with signal transduction and cell death in Arabidopsis. Plant Physiol. 141:1056-1067. - PMC - PubMed
    1. Baulcombe, D. C. 2004. RNA silencing in plants. Nature 431:356-363. - PubMed
    1. Bleykasten, C., D. Gilmer, H. Guilley, K. E. Richards, and G. Jonard. 1996. Beet necrotic yellow vein virus 42 kDa triple gene block protein binds nucleic acid in vitro. J. Gen. Virol. 77:889-897. - PubMed
    1. Boevink, P., and K. J. Oparka. 2005. Virus-host interactions during movement processes. Plant Physiol. 138:1815-1821. - PMC - PubMed
    1. Bragg, J. N., and A. O. Jackson. 2004. The C-terminal region of the Barley stripe mosaic virus γb protein participates in homologous interactions and is required for suppression of RNA silencing. Mol. Plant Pathol. 5:465-481. - PubMed

Publication types

MeSH terms

LinkOut - more resources