. 2009 Sep 4;284(36):24553-67.
doi: 10.1074/jbc.M109.019364. Epub 2009 Jul 1.

Differential regulation of elastic fiber formation by fibulin-4 and -5

Affiliations

Differential regulation of elastic fiber formation by fibulin-4 and -5

Rawshan Choudhury et al. J Biol Chem. .

Abstract

Fibulin-4 and -5 are extracellular glycoproteins with essential non-compensatory roles in elastic fiber assembly. We have determined how they interact with tropoelastin, lysyl oxidase, and fibrillin-1, thereby revealing how they differentially regulate assembly. Strong binding between fibulin-4 and lysyl oxidase enhanced the interaction of fibulin-4 with tropoelastin, forming ternary complexes that may direct elastin cross-linking. In contrast, fibulin-5 did not bind lysyl oxidase strongly but bound tropoelastin in terminal and central regions and could concurrently bind fibulin-4. Both fibulins differentially bound N-terminal fibrillin-1, which strongly inhibited their binding to lysyl oxidase and tropoelastin. Knockdown experiments revealed that fibulin-5 controlled elastin deposition on microfibrils, although fibulin-4 can also bind fibrillin-1. These experiments provide a molecular account of the distinct roles of fibulin-4 and -5 in elastic fiber assembly and how they act in concert to chaperone cross-linked elastin onto microfibrils.


Figures

FIGURE 1.
FIGURE 1.
A, recombinant human fibulin-4 and -5. Domain structures of full-length fibulin-4 (F4), C-terminally truncated fibulin-4 (tF4), the N-terminal half of fibulin-4 (nF4), and the five central cbEGFs (eF4) are shown, with a key of the domains and N-glycosylation sites. Also shown are the domain structures of full-length fibulin-5 (F5) with the sites of the two cutis laxa mutations (F5C217R and F5S227P) and domain pair fragments. Details of the domains are given (see key). For SDS-PAGE analysis of recombinant fibulins, see supplemental Fig. S1A. B, recombinant human fibrillin-1. Domain structures of full-length fibrillin-1, a C-terminally truncated two-third fragment of fibrillin-1 (tFib-1), overlapping fragments, and N-terminal deletion fragments are shown, with a key of the domains and N-glycosylation sites. All fragments have been described (39, 55) except for tFib-1 (for mass spectrometry of tFib-1, see supplemental Fig. S2B). Details of the domains are given (see key), and the colors indicate overlapping recombinant fragments. For SDS-PAGE analysis of recombinant tFib-1, see supplemental Fig. S1B. C, recombinant human LOX. The molecular arrangement of full-length human LOX is shown. BMP-1, position of the bone morphogenetic protein-1 cleavage site. For SDS-PAGE analysis of recombinant LOX, see supplemental Fig. S1C. EGF, epidermal growth factor.
FIGURE 2.
FIGURE 2.
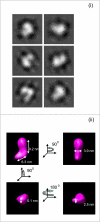
Electron microscopy and single particle averaging of full-length fibulin-4. F4 was equilibrated in TBS prior to adsorption onto carbon-coated grids. i, representative class averages from a data set of 3538 fibulin-4 molecules. ii, a three-dimensional reconstruction of fibulin-4 was generated using angular reconstitution. For i and ii, the box size is 19 × 19 nm. The data indicate that the length of fibulin-4 is 13–14 nm with a central bend and a globular end-domain. This result extends previous rotary shadowing studies of fibulin-4 molecules, which indicated short rods of 10–20 nm in length and an end globule (4, 51).
FIGURE 3.
FIGURE 3.
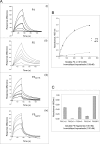
Molecular interactions of tropoelastin with fibulin-4 and -5. A, BIAcore analysis of interactions of immobilized tropoelastin with full-length fibulin-4 (F4) (i) or fibulin-5 (F5, F5C217R, or F5S227P) (ii–iv). These soluble ligands were injected over tropoelastin immobilized on a CM5 chip (see Table 2). Each sensorgram shows analyte concentrations ranging from 2 to 10 μg/ml (for F4) or from 0.4 to 10 μg/ml (for F5), with duplicate concentrations included in every run. One representative experiment is shown. Response difference is the difference between experimental and control flow cells, in response units. Time is shown in seconds. F4, F5C217R, and F5S227P showed faster dissociation than F5 from tropoelastin. B, solid phase binding curves showing that soluble biotinylated F4 bound strongly to immobilized tropoelastin but nF4 binding was very weak. One representative experiment is shown. Data are shown with the negative (biotinylated F4 only) control subtracted. Results are shown as the mean ± S.E. of triplicate values. C, solid phase binding assays localizing tropoelastin binding sites on biotinylated fibulin-5. Three of the domain pair fragments, F5-E1+2, F5-E4+5, and F5-E6FC, bound well to immobilized tropoelastin (KD values of 332, 452, and 965 nm, respectively; binding curves are shown in supplemental Fig. S4A), but fragments F5-E2+3 and F5-E5+6 interacted only very weakly. One representative experiment is shown. Data are shown with the negative (biotinylated F5 fragments only) control subtracted. Results are shown as the mean ± S.E. of triplicate values.
FIGURE 4.
FIGURE 4.
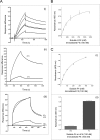
Molecular interactions of LOX with fibulin-4 and -5. A, BIAcore analysis of interactions of immobilized LOX with soluble F4 (i) or nF4 or tF4 (ii) injected over LOX immobilized on a CM5 chip (see Table 2). In iii, BIAcore interactions of immobilized F4 with soluble LOX, PF1, and F5 are shown (virtually no interaction was detected with PF2). In i, the sensorgram shows analyte concentrations ranging from 2 to 10 μg/ml, with duplicate concentrations included in every run. One representative experiment in each case is shown. Response difference is the difference between experimental and control flow cells, in response units. Time is shown in seconds. F4 and nF4 bound strongly to LOX, but tF4 bound weakly. In parallel solid phase assays, F4 was confirmed to bind strongly to LOX (not shown). B, solid phase binding assays showing soluble biotinylated LOX binding to immobilized F5 (KD = 338 nm). One representative experiment is shown in each case. Data are shown with the negative (biotinylated LOX only) control subtracted. Results are shown as the mean ± S.E. of triplicate values. Soluble biotinylated LOX also bound strongly to four of the fibulin-5 domain pair fragments (F5-E1+2, F5-E2+3, F5-E4+5, and F5-E6FC), but in parallel BIAcore experiments, there was no detectable binding of full-length fibulin-5 (F5) to LOX (not shown). C, solid phase binding assays showing soluble biotinylated F4 binding to immobilized F5. i and ii, F4 bound strongly to F5, but nF4 shows virtually no binding to F5 (ii). Thus, the binding site for fibulin-5 is in the C-terminal half of fibulin-4. One representative experiment is shown. Data are shown with the negative (biotinylated F4 or nF4 only) control subtracted. Results are shown as the mean ± S.E. of triplicate values.
FIGURE 5.
FIGURE 5.
Molecular interactions of fibrillin-1 with fibulin-4 and -5. A, solid phase binding assays showing soluble biotinylated F4 binding to immobilized overlapping fragments encompassing full-length fibrillin-1 (i) and to N-terminal (PF1) deletion and short fragments (ii). F4 bound well to the N-terminal fragments PF1 and PF2 and to several N-terminal deletion fragments but very weakly to PF4, Ex5–7, and Ex7–11. In iii, binding curves show that soluble biotinylated F4 bound to immobilized PF1 and PF2. In iv, binding curves are shown for soluble biotinylated F4 and nF4 binding to immobilized PF1, indicating that the N-terminal half of fibulin-4 binds N-terminal fibrillin-1. One representative experiment is shown in each case. Data are shown with the negative (biotinylated F4 or nF4 only) control subtracted. Results are shown as the mean ± S.E. of triplicate values. B, solid phase binding assays show soluble biotinylated fibrillin1 (PF1 fragment) binding to immobilized F5 (i) and soluble biotinylated F5 binding to immobilized N-terminal fibrillin-1 fragments (ii). F5 bound well to the N-terminal fragments PF1 and PF4 and to several N-terminal deletion fragments but weakly to PF2 and Ex7–11. One representative experiment is shown. Data are shown with the negative (biotinylated F5 only) control subtracted. Results are shown as the mean ± S.E. of triplicate values. C, domain diagram of fibrillin-1 (see Fig. 1 for key), highlighting potential binding sites for F4 and F5, as well as reported binding sites for tropoelastin (33, 39). D, solid phase assays showing soluble biotinylated fibulin-5 fragments (F5-E1+2 (i) or F5-E6FC (ii)) binding to immobilized PF1 or to three different PF1 (Marfan syndrome) mutants (Fig. 1B). Fibulin-5 fragments bound well to PF1, but binding was significantly reduced to all of these PF1 mutants, especially PF1S115C. Data are shown with the negative (biotinylated protein only) control subtracted. Results are shown as the mean ± S.E. of triplicate values. Significant differences in binding of each fibulin-5 fragment to PF1 or to the PF1 mutants are shown as follows: ***, p < 0.001 (unpaired t test). In each case, a representative experiment is shown.
FIGURE 6.
FIGURE 6.
Molecular interactions of LOX with fibrillin-1 and tropoelastin. A, solid phase binding assays showing soluble biotinylated LOX binding to immobilized fibrillin-1. i and ii, LOX binds to the N-terminal fibrillin-1 fragment PF1 and shows reduced binding to PF1 deletion fragments but no binding to Ex5–7. iii, binding curve showing soluble biotinylated LOX binding to immobilized PF1. One representative experiment is shown. Data are shown with the negative (biotinylated LOX only) control subtracted. Results are shown as the mean ± S.E. of triplicate values. B, solid phase binding curve showing soluble biotinylated LOX binding to immobilized tropoelastin. One representative experiment is shown. Data are shown with the negative (biotinylated LOX only) control subtracted. Results are shown as the mean ± S.E. of triplicate values.
FIGURE 7.
FIGURE 7.
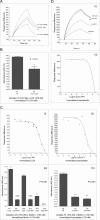
Molecular interactions and competition assays. A, analysis of the effect of LOX on soluble F4 interacting with immobilized tropoelastin. In BIAcore experiments, F4 was soluble ligand alone or preincubated with LOX. F4 binding to tropoelastin was enhanced following preincubation of F4 with LOX (both at 200 nm) but reduced following F4 preincubation with 1000 nm LOX. (LOX does not bind immobilized tropoelastin; not shown.) One representative experiment is shown. Response difference is the difference between experimental and control flow cells, in response units. Time is shown in seconds. B, solid phase binding assay showing that preincubation of soluble biotinylated F4 with LOX (both at 100 nm) partially inhibited the interaction of F4 with immobilized F5. A significant difference in binding of F4 preincubated with LOX to F5 was shown as follows: **, p < 0.01 (unpaired t test). One representative experiment is shown. Data are shown with the negative (biotinylated protein only) control subtracted. Results are shown as the mean ± S.E. of triplicate values. C, analysis of the effect of PF1 on soluble F4 interacting with immobilized LOX or tropoelastin. In BIAcore experiments (i and ii), F4 was a soluble ligand, alone or preincubated with increasing concentrations of PF1 (Log10 Conc PF1). F4 binding to LOX (i) and to tropoelastin (ii) was inhibited by PF1, with EC50 values of 365 and 115 nm, respectively. In each case, one representative experiment is shown. Response difference is the difference between experimental and control flow cells, in response units. iii, solid phase binding assays confirmed both that soluble biotinylated LOX (100 nm) interacted with immobilized F4 and nF4 but more weakly with tF4 and that preincubation of LOX with PF1 (100 nm) strongly inhibited all of these interactions. Significant differences in binding of LOX preincubated with PF1 to F4, nF4, or tF4 were shown as follows: ***, p < 0.001 (unpaired t test). iv, solid phase binding assays confirmed both that soluble biotinylated F4 (100 nm) interacted with immobilized tropoelastin and that preincubation of soluble F4 with PF1 or PF4 (all at 100 nm) strongly inhibited this interaction. Significant differences in binding of F4 or F4 preincubated with PF1 to tropoelastin were shown as follow: ***, p < 0.001 (unpaired t test). In each case, one representative experiment is shown. Data are shown with the negative (biotinylated protein only) control subtracted. Results are shown as the mean ± S.E. of triplicate values. BIAcore analysis of soluble F4 interacting with immobilized tropoelastin confirmed that preincubation of F4 with tFib-1 (a C-terminally truncated two-thirds fragment of fibrillin-1) markedly inhibits F4 binding to tropoelastin (see supplemental Fig. S4D). D, BIAcore analysis of soluble F5 interacting with immobilized tropoelastin. In i, F5 was soluble ligand alone, or preincubated with either LOX or F4 or with the fibrillin-1 fragments PF1 or tFib-1 (all at 200 nm). The ability of F5 to bind tropoelastin was unaffected by preincubation with LOX or F4 but was inhibited by PF1 (which does not contain tropoelastin binding sites) and inhibited more strongly by tFib-1 (which contains tropoelastin binding sites; see Fig. 4D). ii, increasing concentrations of soluble PF1 (Log10 Conc PF1) inhibited binding of F5 to tropoelastin. In each case, one representative experiment is shown. Response difference is the difference between experimental and control flow cells, in response units.
FIGURE 8.
FIGURE 8.
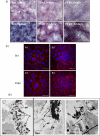
shRNA knockdown of fibulin-5 in RFL6 cells. i, Miller's elastin staining of RFL6 scrambled control (Scr) and fibulin-5 shRNA knockdown (F5 kd) cultures (8 and 12 days); this stain highlights elastin as dark deposits. The scrambled control cultures contained a dense network of elastin, whereas the F5 knockdown cells formed prominent thick elastin arrays. Scale bars, 250 μm. ii, immunofluorescence microscopy of RFL6 scrambled control and fibulin-5 shRNA knockdown cultures (4 and 8 days; 4d and 8d, respectively), using elastin RA75 polyclonal antibody (red) and cell nuclear staining (4′,6-diamidino-2-phenylindole; blue). By 8 days, the fibulin-5 knockdown cultures showed more prominent staining of elastin than the scrambled control cultures. Scale bars, 50 μm. iii, transmission electron microscopy of RFL6 scrambled control and fibulin-5 shRNA knockdown cultures at 10 days. In the scrambled control cultures, elastin was accreting within microfibril bundles, whereas in the fibulin-5 knockdown cells, small elastin globules (indicated by an asterisk) formed large aggregates that were mainly distinct from microfibrils. MF, microfibrils; E, elastin. Scale bars, 1.4 μm.
FIGURE 9.
FIGURE 9.
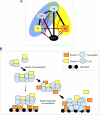
Modeling elastic fiber interactions of fibulin-4 and -5. A, schematic diagram showing the elastic fiber interactions of fibulin-4 and -5. Thick black lines represent strong interactions, and thinner black lines show weaker interactions. Red lines indicate how fibrillin-1 binding to fibulins inhibits their interactions with LOX and tropoelastin. The blue oval highlights the ternary complex between fibulin-4, LOX, and tropoelastin, and the yellow oval highlights the complex between fibulin-5 and tropoelastin. TE, tropoelastin; Fib-1, fibrillin-1; F4, fibulin-4; F5, fibulin-5. B, schematic model indicating how fibulin interactions may contribute to elastic fiber assembly. Our binding data indicate that fibulin-4-LOX interactions facilitate formation of ternary complexes with tropoelastin; these complexes may regulate LOX activation and elastin cross-linking. Following fibulin-5 depletion, elastin appears aggregated and distinct from microfibrils, so fibulin-5 must normally regulate elastin globules and direct their interaction with microfibrils, either by first associating with microfibrils and then attracting elastin globules to bind microfibrils or by first associating with elastin globules and then facilitating their deposition on microfibrils. Our data support the latter model. Once localized at microfibrils, elastin probably interacts directly with fibrillin-1, since these interactions can be high affinity (39), and fibulin-5 interactions with fibrillin-1 and tropoelastin are mutually inhibitory. Active LOX may remain associated with and cross-link coalescing elastin globules on microfibrils. Fibulin-4 and -5 may remain associated with microfibrils or may “recycle” for further elastin deposition.

Similar articles

Cited by

References

    1. Chu M. L., Tsuda T. (2004) Birth Defects Res. C Embryo Today 72, 25–36 - PubMed
    1. de Vega S., Iwamoto T., Yamada Y. (2009) Cell Mol. Life Sci. 66, 1890–1902 - PMC - PubMed
    1. Timpl R., Sasaki T., Kostka G., Chu M. L. (2003) Nat. Rev. Mol. Cell Biol. 4, 479–489 - PubMed
    1. Kobayashi N., Kostka G., Garbe J. H., Keene D. R., Bächinger H. P., Hanisch F. G., Markova D., Tsuda T., Timpl R., Chu M. L., Sasaki T. (2007) J. Biol. Chem. 282, 11805–11816 - PubMed
    1. McLaughlin P. J., Chen Q., Horiguchi M., Starcher B. C., Stanton J. B., Broekelmann T. J., Marmorstein A. D., McKay B., Mecham R., Nakamura T., Marmorstein L. Y. (2006) Mol. Cell Biol. 26, 1700–1709 - PMC - PubMed

Publication types

MeSH terms