. 2009 Jul 1;29(26):8388-95.
doi: 10.1523/JNEUROSCI.0717-09.2009.

The role of human orbitofrontal cortex in value comparison for incommensurable objects

Affiliations

The role of human orbitofrontal cortex in value comparison for incommensurable objects

Thomas H B FitzGerald et al. J Neurosci. .

Abstract

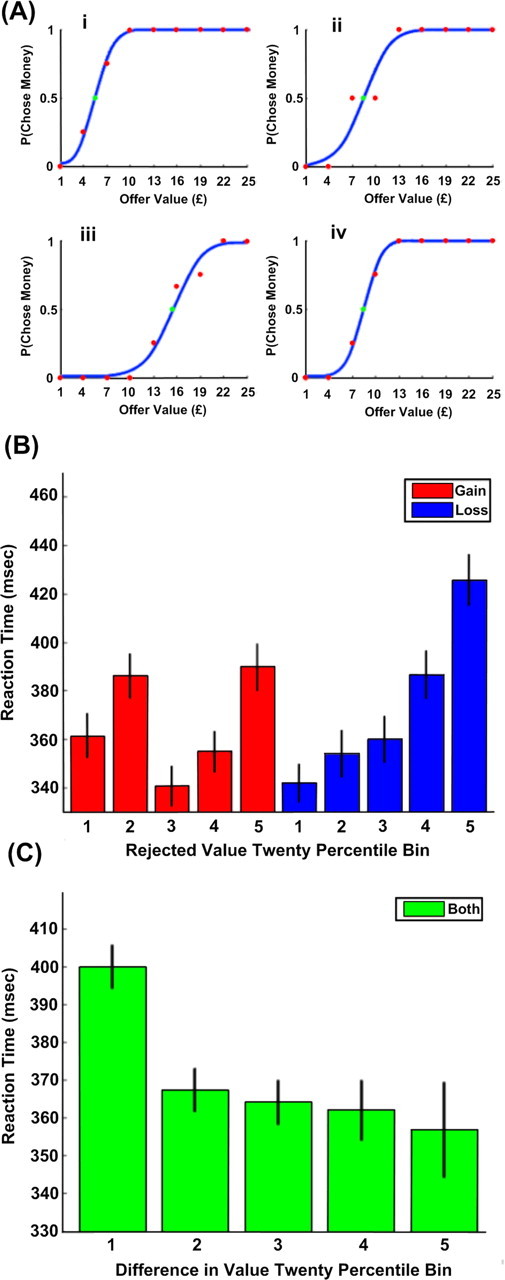
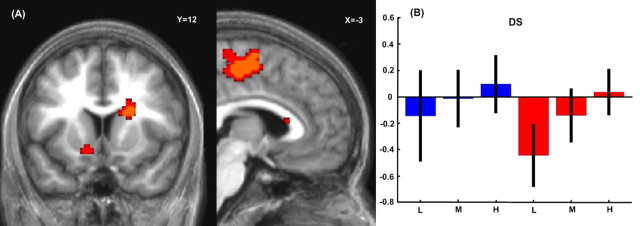
The human orbitofrontal cortex is strongly implicated in appetitive valuation. Whether its role extends to support comparative valuation necessary to explain probabilistic choice patterns for incommensurable goods is unknown. Using a binary choice paradigm, we derived the subjective values of different bundles of goods, under conditions of both gain and loss. We demonstrate that orbitofrontal activation reflects the difference in subjective value between available options, an effect evident across valuation for both gains and losses. In contrast, activation in dorsal striatum and supplementary motor areas reflects subjects' choice probabilities. These findings indicate that orbitofrontal cortex plays a pivotal role in valuation for incommensurable goods, a critical component process in human decision making.


Figures

Figure 1.
Figure 1.
Illustration of a single trial of the task paradigm (trials were visually identical in both gain and loss sessions). Subjects fixated for an interval jittered between 2000 and 2500 ms, after which they were presented with a choice between a sum of money between £1 and £25 and a bundle of one or more items. In gain sessions, subjects had been shown both money and items, but not yet received them, and they were asked to decide which they would prefer to acquire out of the money and the items. In loss sessions, subjects had already been given £25 and all items to be offered in that particular session, and were asked to choose which they would prefer to give up. These options, as illustrated, were displayed for 2200 ms on either side of the fixation cross. They then disappeared, and after an interval of 500 ms, two green circles appeared, instructing the subject to make a choice. Successful choices (made within the 1000 ms choice-screen display time) were indicated by the appearance of a red ring around the circle on the side chosen.
Figure 2.
Figure 2.
A, Money-offer choice probabilities (red dots) fitted with logistic sigmoids (blue lines) for four different offer types (i: one box of chocolates, ii: three USB sticks, iii: two boxes of biscuits, iv: two USB sticks) in four different subjects. The data in i and ii were collected under the gain condition, and those in iii and iv were collected under the loss condition. The green dot indicates the estimated indifference point (here £5.48, 8.47, 15.54, 8.48), used to infer the value of the item bundle. B, Reaction time data pooled between all subjects and binned in 20 percentiles according to the value of the rejected option. Bars in blue indicate reaction times from the gain frame, while bars in red indicate loss. Black lines represent 90% confidence intervals. Reaction times were significantly longer in the loss frame than in the gain frame. There was also a significant effect of rejected offer value, and a significant interaction between this and the frame, where larger values are more strongly correlated with longer reaction times in the loss frame. C, Reaction time data pooled between all subjects and in both frames and binned in percentiles of 20 according to the difference between the option values. Black lines represent 90% confidence intervals. The difference in value was inversely correlated with the reaction time, but this showed no interaction with the frame (gain or loss).
Figure 3.
Figure 3.
A, Regions where activation correlated with the difference in value between presented options in the medial orbitofrontal cortex and posterior cingulate cortex (image is at x = 0) (yellow: p < 0.001, red: p < 0.005, clusters >100 mm3 in size shown). B, Parameter estimates for activation in the medial orbitofrontal cortex ROI at low (L), medium (M), and high (H) difference values. Estimates in the gain frame are in blue, and those for the loss frame are in red. Black lines indicate 90% confidence intervals.
Figure 4.
Figure 4.
A, Activity in the caudate nucleus and supplementary motor area correlated with the maximum choice probability as estimated by the logit analysis (left image is at y = 12, right is at x = −3) (yellow: p < 0.001, red: p < 0.005, clusters >100 mm3 in size shown). B, Parameter estimates for activation in the dorsal striatum (DS) ROI at low (L), medium (M), and high (H) maximum choice probabilities. Estimates in the gain frame are in blue, and those for the loss frame are in red. Black lines indicate 90% confidence intervals.

References

    1. Alexander GE, Crutcher MD, DeLong MR. Basal ganglia-thalamocortical circuits: parallel substrates for motor, oculomotor, “prefrontal” and “limbic” functions. Prog Brain Res. 1990;85:119–146. - PubMed
    1. Averbeck BB, Latham PE, Pouget A. Neural correlations, population coding and computation. Nat Rev Neurosci. 2006;7:358–366. - PubMed
    1. Blavatsky PR. Stochastic utility theorem. J Math Econ. 2008;44:1049–1056.
    1. Botvinick MM, Cohen JD, Carter CS. Conflict monitoring and anterior cingulate cortex: an update. Trends Cogn Sci. 2004;8:539–546. - PubMed
    1. Camerer C, Ho TH. Experience-weighted attraction learning in normal form games. Econometrica. 1999;67:827–874.

Publication types

MeSH terms

LinkOut - more resources