. 2009 Jul 1;29(26):8512-24.
doi: 10.1523/JNEUROSCI.0754-09.2009.

Bistability and non-Gaussian fluctuations in spontaneous cortical activity

Affiliations

Bistability and non-Gaussian fluctuations in spontaneous cortical activity

Frank Freyer et al. J Neurosci. .

Abstract

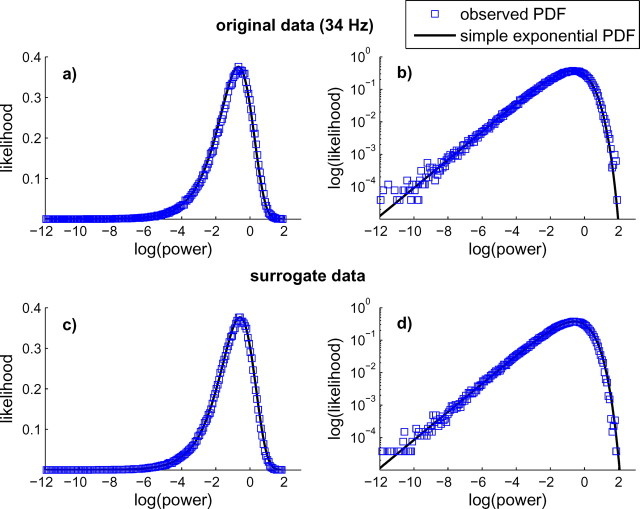
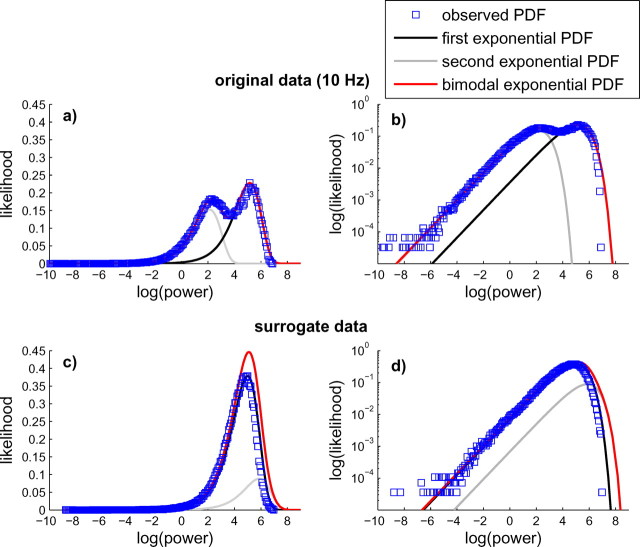
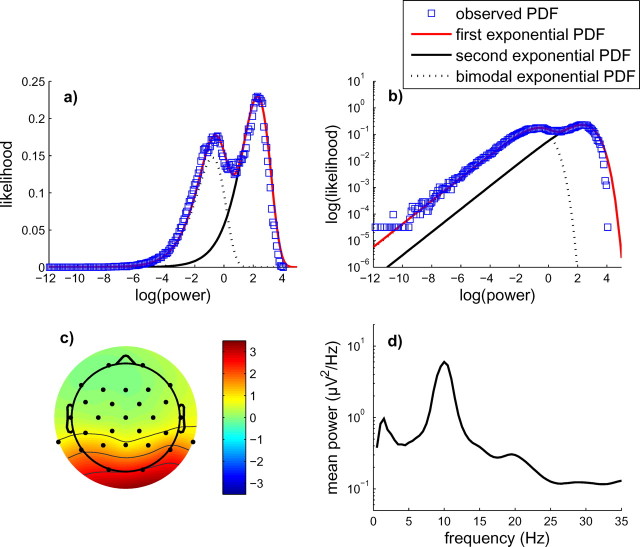
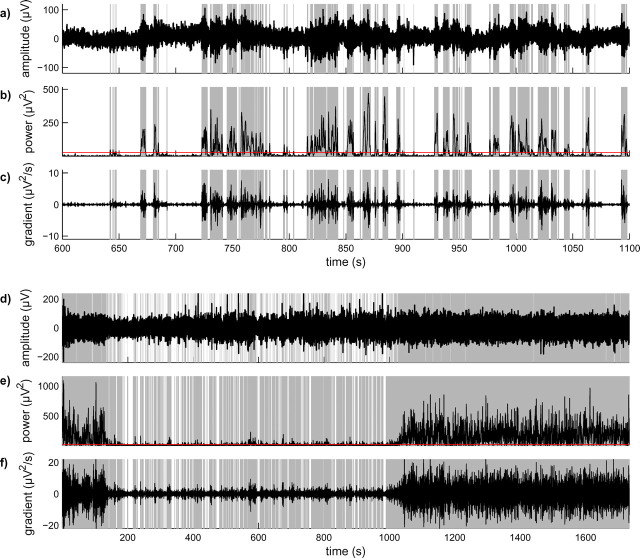
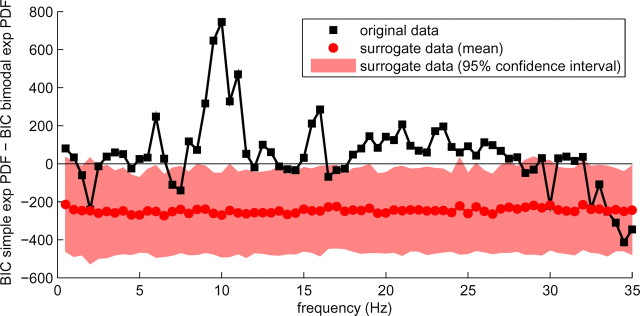
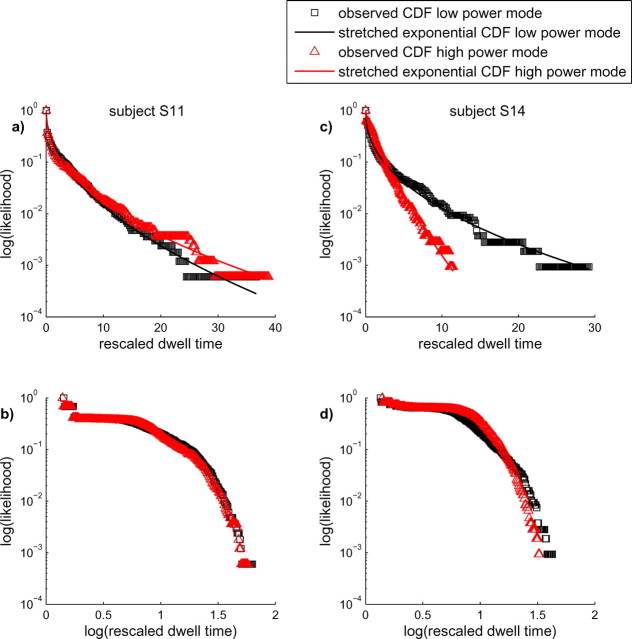
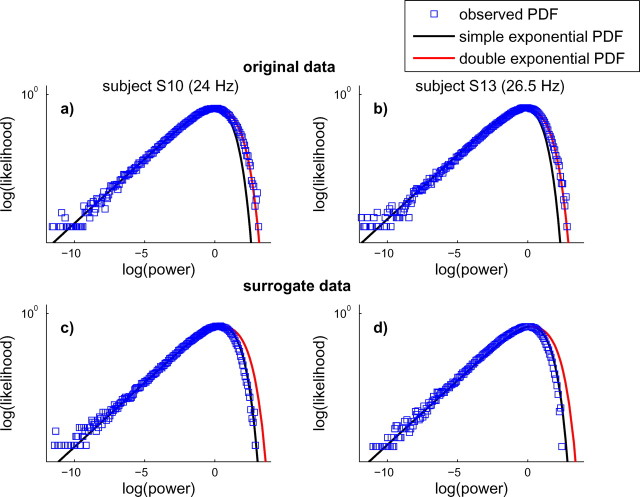
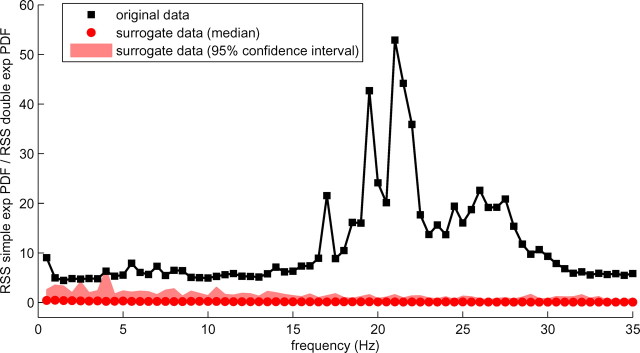
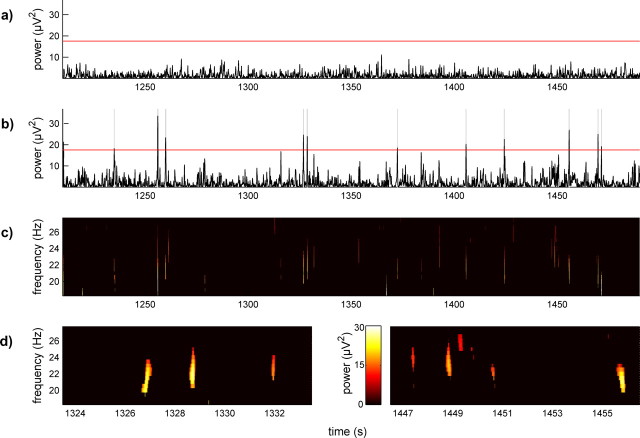
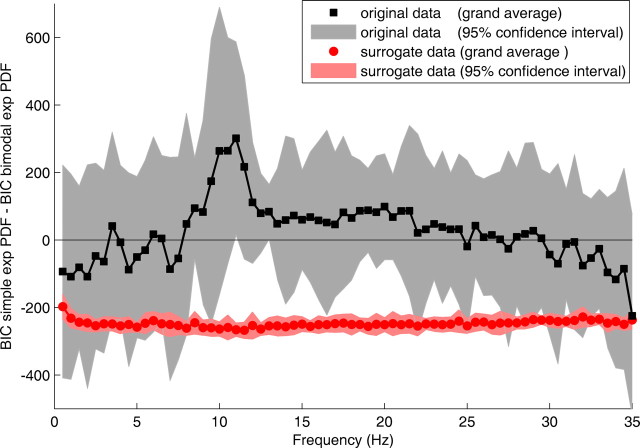
The brain is widely assumed to be a paradigmatic example of a complex, self-organizing system. As such, it should exhibit the classic hallmarks of nonlinearity, multistability, and "nondiffusivity" (large coherent fluctuations). Surprisingly, at least at the very large scale of neocortical dynamics, there is little empirical evidence to support this, and hence most computational and methodological frameworks for healthy brain activity have proceeded very reasonably from a purely linear and diffusive perspective. By studying the temporal fluctuations of power in human resting-state electroencephalograms, we show that, although these simple properties may hold true at some temporal scales, there is strong evidence for bistability and nondiffusivity in key brain rhythms. Bistability is manifest as nonclassic bursting between high- and low-amplitude modes in the alpha rhythm. Nondiffusivity is expressed through the irregular appearance of high amplitude "extremal" events in beta rhythm power fluctuations. The statistical robustness of these observations was confirmed through comparison with Gaussian-rendered phase-randomized surrogate data. Although there is a good conceptual framework for understanding bistability in cortical dynamics, the implications of the extremal events challenge existing frameworks for understanding large-scale brain systems.


Figures

Figure 1.
Figure 1.
Example of a simple unimodal distribution of power at 34 Hz in a single subject (S10). a, b, Observed PDF in log–log (a) and log–linear (b) coordinates obtained from original data. Blue squares show the observed distribution, and the black line shows the fitted exponential function (Eq. 1). c, d, The observed and fitted distributions obtained from surrogate data in log–log (c) and log–linear (d) coordinates.
Figure 2.
Figure 2.
Example of strongly bimodal distribution in a single subject (S11) at 10 Hz. Panels as per Figure 1. The red line shows the sum of the two unimodal forms.
Figure 3.
Figure 3.
a, b, Example of a bimodal distribution in a single independent component in log–log (a) and log–linear (b) coordinates at 10.5 Hz. c, Spatial distribution of this component. Color bar shows weighting of component over scalp electrodes (dimensionless units). d, Power spectrum estimated from wavelet coefficients.
Figure 4.
Figure 4.
Examples of mode switching in two subjects (top, S14; bottom, S11). a–f, Time series for the original O2 electrode data (a, d), the power (amplitude squared) of the wavelet coefficients for this frequency (b, 10 Hz; e, 10.5 Hz), and its temporal derivative (c, f). Panels have gray shading whenever the system is in the high-amplitude mode. The red line in b and e show the power at which the modes have equal likelihoods. This threshold was derived from the crossing of the two PDFs (see Fig. 2).
Figure 5.
Figure 5.
Difference between Bayesian information criterion for unimodal and bimodal fits in a single subject (S11). Positive (negative) values indicate preference for bimodal (unimodal) exponential PDF. Results from original data are shown in black. Mean and 95% confidence intervals for surrogate data are shown in red.
Figure 6.
Figure 6.
Representative CDFs for the bimodal dwell times in two subjects, rescaled to their mean. a and b show data from subject S11, and c and d show data from subject S14. Empirical distributions for low-power and high-power modes are given as black squares and red triangles, respectively, in linear–log (a, c) and log–log (b, d) coordinates. Stretched exponential CDFs are plotted as solid lines in the linear–log coordinates with α = 1.45, β = 0.45 for the low-power (black) mode and α = 1.35, β = 0.5 for the high-power (red) mode in the first subject (a). The parameters in the second subject (b) are α = 1.55, β = 0.45 for the low-power (black) mode and α = 1.15, β = 0.75 for the high-power (red) mode.
Figure 7.
Figure 7.
Examples of non-Gaussian unimodal distributions in two subjects. a and b show observed PDFs. Fitted simple-exponential PDFs (Eq. 1) are depicted as black solid lines, and fitted double-exponential PDFs (Eq. 5) are shown in red above the mean. c and d show corresponding fits to phase-randomized surrogate data from same subjects.
Figure 8.
Figure 8.
Ratio of the RSS of the single-exponential PDF (Eq. 1) to the double-exponential PDF (Eq. 5) in a single subject (S12). Mean and 95% confidence intervals (±1.96 SDs) were estimated from surrogate data using nonparametric rank ordering.
Figure 9.
Figure 9.
Exemplar extremal events in a single subject (S12). a, b, Power time series at 22 Hz in surrogate (a) versus real data (b), both scaled to have unit mean. Red line shows the 95% relative likelihood for the double-exponential compared with single-exponential fit. c and d show two complementary views of the time–frequency plane of the empirical data after thresholding at the 95% relative likelihood. Colors depict superthreshold power.
Figure 10.
Figure 10.
Grand average BIC difference across 13 of the 16 subjects whose data showed distinctly bimodal PDFs, as shown in supplemental Figure S2 (available at www.jneurosci.org as supplemental material). Mean and 95% confidence intervals (±1.96 SDs) for surrogate data are shown in red.

References

    1. Achard S, Salvador R, Whitcher B, Suckling J, Bullmore E. A resilient, low-frequency, small-world human brain functional network with highly connected association cortical hubs. J Neurosci. 2006;26:63–72. - PMC - PubMed
    1. Allen PJ, Polizzi G, Krakow K, Fish DR, Lemieux L. Identification of EEG events in the MR scanner: the problem of pulse artifact and a method for subtraction. Neuroimage. 1998;8:229–239. - PubMed
    1. Allen PJ, Josephs O, Turner R. A method for removing imaging artifact from continuous EEG recorded during functional MRI. Neuroimage. 2000;12:230–239. - PubMed
    1. Amari S, Nakahara H, Wu S, Sakai Y. Synchronous firing and higher-order interactions in neuron pool. Neural Comput. 2003;15:127–142. - PubMed
    1. Anemüller J, Sejnowski TJ, Makeig S. Complex independent component analysis of frequency-domain electroencephalographic data. Neural Netw. 2003;16:1311–1323. - PMC - PubMed

Publication types

MeSH terms