. 2009 Jul 1;29(26):8551-64.
doi: 10.1523/JNEUROSCI.5784-08.2009.

TWIK-1 and TREK-1 are potassium channels contributing significantly to astrocyte passive conductance in rat hippocampal slices

Affiliations

TWIK-1 and TREK-1 are potassium channels contributing significantly to astrocyte passive conductance in rat hippocampal slices

Min Zhou et al. J Neurosci. .

Abstract

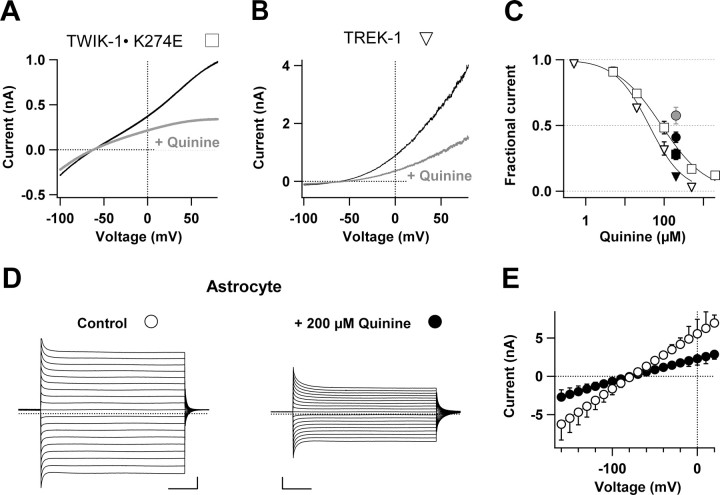
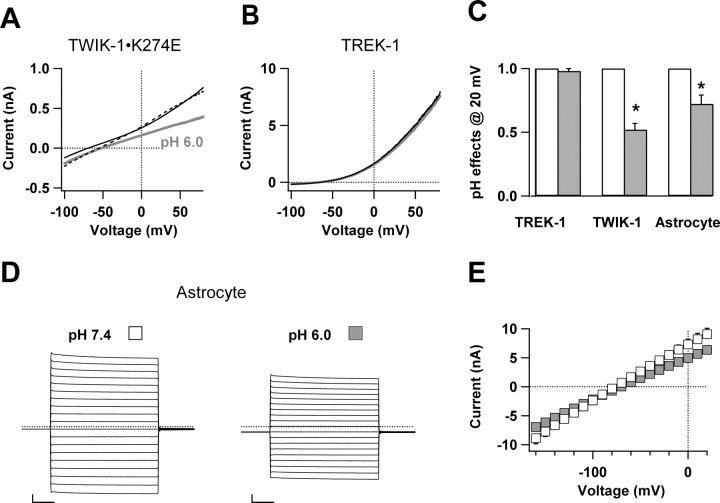
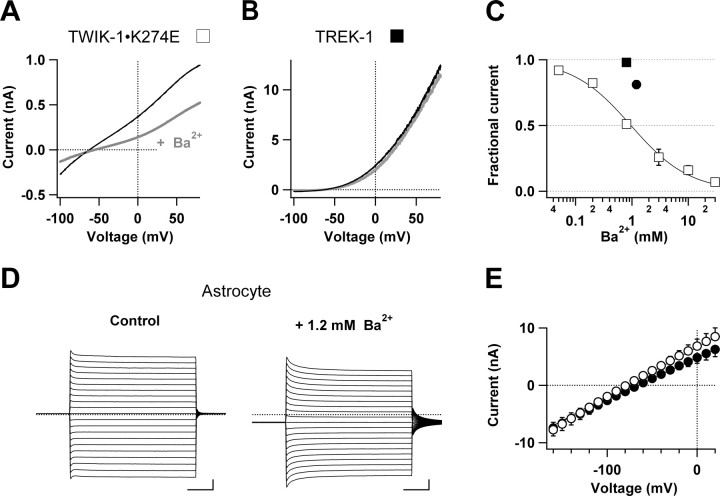
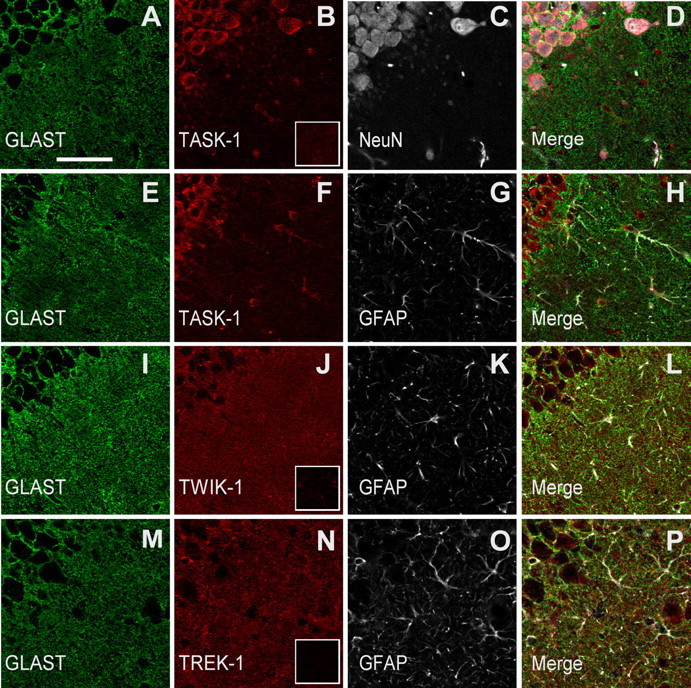
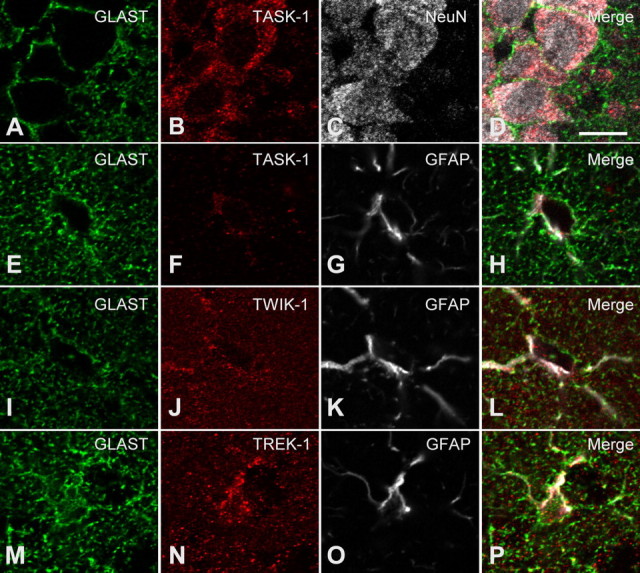
Expression of a linear current-voltage (I-V) relationship (passive) K(+) membrane conductance is a hallmark of mature hippocampal astrocytes. However, the molecular identifications of the K(+) channels underlying this passive conductance remain unknown. We provide the following evidence supporting significant contribution of the two-pore domain K(+) channel (K(2P)) isoforms, TWIK-1 and TREK-1, to this conductance. First, both passive astrocytes and the cloned rat TWIK-1 and TREK-1 channels expressed in CHO cells conduct significant amounts of Cs(+) currents, but vary in their relative P(Cs)/P(K) permeability, 0.43, 0.10, and 0.05, respectively. Second, quinine, which potently inhibited TWIK-1 (IC(50) = 85 microm) and TREK-1 (IC(50) = 41 microm) currents, also inhibited astrocytic passive conductance by 58% at a concentration of 200 microm. Third, a moderate sensitivity of passive conductance to low extracellular pH (6.0) supports a combined expression of acid-insensitive TREK-1, and to a lesser extent, acid-sensitive TWIK-1. Fourth, the astrocyte passive conductance showed low sensitivity to extracellular Ba(2+), and extracellular Ba(2+) blocked TWIK-1 channels at an IC(50) of 960 microm and had no effect on TREK-1 channels. Finally, an immunocytochemical study showed colocalization of TWIK-1 and TREK-1 proteins with the astrocytic markers GLAST and GFAP in rat hippocampal stratum radiatum. In contrast, another K(2P) isoform TASK-1 was mainly colocalized with the neuronal marker NeuN in hippocampal pyramidal neurons and was expressed at a much lower level in astrocytes. These results support TWIK-1 and TREK-1 as being the major components of the long-sought K(+) channels underlying the passive conductance of mature hippocampal astrocytes.


Figures

Figure 1.
Figure 1.
Characteristics of astrocyte passive conductance. A, DIC image of an astrocyte in the CA1 stratum radiatum during single-astrocyte dual-patch whole-cell recording, with two recording electrodes (shadows) sealed on the cell somata. While the conventional whole-cell recording was performed in one of the electrodes (the left electrode in A), the actual membrane potential (VM) change following the delivery of command voltages was recorded by the second electrode simultaneously (right electrode in A). B, Command voltage pulse protocol: 200 ms test voltages were stepped from −180 mV to +20 mV with an increment of 20 mV from a holding potential of −80 mV. C, E, The whole-cell currents recorded from the left electrode and actual membrane potentials VM recorded from the right electrode, respectively. D, Superimposing the current–command voltage relationship (I–VC) and current–membrane potential relationship (I–VM) from the same dual-patch recording revealed an ∼80% deficit of VM from the expected VC in voltage-clamp recording. The outward rectifying GHK currents generated by using the same chemical gradient of K+ in the recording solutions ([K+]i/[K+]o = 140/3.5 mm) is also shown in E, indicating a considerable deviation of the passive conductance from the expected GHK constant field rectification. As the GHK fit assumed only membrane permeability for the K+ ion, the GHK fit yielded a reversal potential of −93 mV, differing from the actual reversal potential of −87 mV measured from the dual-patch-recorded astrocyte.
Figure 2.
Figure 2.
The selectivity of astrocyte passive conductance to K+. A–C, Whole-cell currents evoked by command voltages stepped from −160 mV to +20 mV in 10 mV increments in an astrocyte when the bath solution K+ concentration was elevated from 3.5 mm (A) to 40 mm (B) and to 128.5 mm (C). D, The corresponding current–voltage relationships for the recordings shown in A–C as indicated. Symbols are defined in A–C. The currents used for these I–V plots were measured at the ends of the test pulses (dashed vertical lines in A–C). E, The mean reversal potentials in A–C (filled squares, n = 4) and the calculated K+ equilibrium potentials from Nernst equation (open squares, EK) are plotted against extracellular K+ concentrations. The continuous lines are linear fits that yielded the slope values of 49.3 ± 0.8 mV and 58.2 mV for the measured astrocyte VMs and EKs, respectively.
Figure 3.
Figure 3.
Cs+ effects on astrocyte passive conductance. A, B, Two representative whole-cell recordings of astrocytes; one recorded with K+-based solutions (A) and another with Cs+-based recoding solutions (B). C, I–V plots of averaged Cs+-mediated (filled circles, n = 5) and K+-mediated (open circles, n = 5) conductances. When Cs+ was substituted for K+ in the recording pipette and bath solutions, the Cs+-conducted currents still showed a linear I–V relationship and negative reversal potential in the astrocyte recording (n = 5). D, E, Two representative NG2 glia whole-cell recordings, one recorded with K+-based (D) and the other with Cs+-based (E) solutions. Under both conditions, the NG2 glia could still be identified based on low-density expression of voltage-gated Na+ channels after capacitive and leak currents subtraction (insets in D and E) and positive immunostaining to NG2 antibody after recording (data not shown). Calibration: 100 ms, 1 nA. F, I–V plots of Cs+-mediated (filled circles, n = 6) and K+-mediated (open circles, n = 15) conductances of NG2 glia.
Figure 4.
Figure 4.
The relative Cs+ permeability of astrocyte passive conductance and cloned TWIK-1 and TREK-1 K+ channels. A, Astrocyte reversal potential VM (at 0 currents) shifted when bath solutions were switched from normal aCSF containing 3.5 mm K+ to the modified aCSF solutions containing, in sequence, 70 mm K+, Rb+, and Cs+. Astrocyte VM (at 0 current) at the steady-state level was recorded for 2 s for each ionic condition by continuous current-clamp recording. B, E, The voltage ramp-induced whole-cell current traces recorded from two CHO cells, one transfected with TWIK-1 (B) and another with TREK-1 (E) K+ channels. In each case, the current traces recorded in 135 mm Na+ (black traces), 135 mm K+ (dashed black traces), and 135 mm Cs+ (gray traces) bath solutions are shown. C, F, Representative traces of TWIK-1 and TREK-1 K+ channel whole-cell currents recorded with Cs+- and K+-based solutions as indicated. For the TWIK-1 K+ channels, the Cs+-conducted whole-cell currents showed a strong outward rectification and the overall whole-cell current at +50 mV is significantly larger than that of the K+-conducted whole-cell currents (56.6 ± 5.9 pA/pF vs 31.6 ± 2.5 pA/pF, n = 6). The Cs+-conducted TREK-1 channel currents remained outwardly rectifying and were smaller compared with K+-mediated conductance (at +50 mV, 49.5 ± 4.8 pA/pF vs 1118.4 ± 137.7 pA/pF, n = 5). Calibration: 100 ms and 1 nA. D, The relative permeability of astrocyte passive conductance (gray bars), TREK-1 (black bars), and TWIK-1 (open bars) K+ channels to different monovalent ions. The relative permeability (PX/PK) values in each test were calculated from Equation 2.
Figure 5.
Figure 5.
The sensitivity of astrocyte passive conductance and cloned TWIK-1 and TREK-1 K+ channels to quinine. A, B, Representative whole-cell current traces recorded from CHO cells expressing TWIK-1 (A) or TREK-1 (B) K+ channels induced by voltage ramp pulses before (black traces) and after (gray traces) application of 100 μm quinine. After washout of quinine, the traces were the same as control traces. C, The dose–response curves of the quinine blockage on TWIK-1 (open triangles) and TREK-1 (filled triangles) channels. The continuous lines were fitted according to Equation 3 that yielded IC50 values of 41.4 ± 4.8 μm and 85.4 ± 9.7 μm and h values of 0.98 and 0.77 for TREK-1 and TWIK-1, respectively (n = 5–6 for each data point). D, Representative astrocyte whole-cell passive currents recorded first in aCSF and then after addition of 200 μm quinine. The voltage pulse protocol was the same as in Figure 2. Calibration: 5 ms, 2 nA. E, The mean current–voltage relationship shows that 200 μm quinine (filled circles) inhibited 58% of passive conductance at the command voltages of +20 mV and −160 mV (also presented as filled circle in C, n = 5). Quinine (200 μm) similarly inhibited Cs+-mediated TWIK-1, TREK-1, and astrocyte passive conductances by 72.0% (filled square, n = 3), 88.0% (filled triangle, n = 4), and 42.5% (gray circle, n = 4), respectively (C).
Figure 6.
Figure 6.
Sensitivity of astrocyte passive conductance and cloned TWIK-1 and TREK-1 K+ channels to extracellular pH. A, B, Representative voltage ramp-induced whole-cell current traces of TWIK-1 and TREK-1 in transfected CHO cells at pH 7.4 (black traces) and pH 6.0 (gray traces). Washout traces are shown as the dashed lines. C, Comparison of effects of extracellular low pH, pH 6.0, on astrocyte passive conductance and expressed TWIK-1 and TREK-1 channels. Whole-cell currents at test voltage +20 mV in the pH 6.0 bath solution (gray bars) are compared with the normalized corresponding values in the pH 7.4 bath solution (open bars) (n = 5–7 for each data point; *p < 0.005). D, Representative whole-cell current traces recorded from an astrocyte in pH 7.4 and pH 6.0 bath solutions. Calibration: 10 ms, 1 nA. E, The mean current–voltage relationships for astrocyte recordings obtained in pH 7.4 (open square) and pH 6.0 (gray square) bath solutions (n = 6). The pooled data show that pH 6.0 significantly inhibited 27% of the outward passive currents at +20 mV of test voltage.
Figure 7.
Figure 7.
Effects of Ba2+ on astrocyte passive conductance and cloned TWIK-1 and TREK-1 K+ channels. A, B, Representative whole-cell current traces recorded from TWIK-1 (A) and TREK-1 (B). K+ channels expressed in CHO cells induced by voltage ramp pulses before (black lines) and after (gray lines) bath application of 800 μm Ba2+. The washout recording traces (dashed lines) are superimposable with the control traces. C, Dose–response curves of Ba2+ blockade of TWIK-1 (open squares) K+ channels. The continuous line is a fit of Equation 3, yielding an IC50 of 960 ± 9.8 μm with h = 0.84. Blockade of astrocyte passive conductance (filled circle) and TREK-1 (filled square) K+ channels at test voltage 20 mV by 1.2 mm Ba2+ and 800 μm Ba2+, respectively, are also shown (n = 5–7 for each data point). D, Representative traces of whole-cell currents recorded from an astrocyte before and after application of 1.2 mm Ba2+ in bath solution. E, The mean current–voltage relationships for the representative recordings shown in D (n = 6). Calibration: 10 ms and 2 nA.
Figure 8.
Figure 8.
Immunocytochemistry of TASK-1, TWIK-1, and TREK-1 channel proteins in CA1 pyramidal cells and in the stratum radiatum. Coronal hippocampal sections were immunofluorescently labeled for one of the three K2P channel proteins, namely, TASK-1 (B, F), TWIK-1 (J), and TREK-1 (N), GLAST (A, E, I, M), and NeuN (C) or GFAP (G, K, O) and imaged with confocal microscopy. Each row of images shows the 3 channels and the merged image from a single field in the CA1 pyramidal cell layer (upper left quadrant of each panel) and the stratum radiatum. TASK-1 immunoreactivity was present in NeuN-immunoreactive pyramidal neurons (A–D) and to a lesser extent in GFAP- and GLAST-immunoreactive astrocytes (E–H). Note that, compared with the TASK-1 immunoreactivity, anti-TWIK-1 and TREK-1 were more intense in the stratum radiatum neuropil, similar to anti-GLAST. The insets in B, J, and N are from images taken from sections treated with the respective K2P antibody preincubated with the blocking peptide. The scale bar in A represents 50 μm and applies to all images in this figure.
Figure 9.
Figure 9.
Immunocytochemistry of TASK-1, TWIK-1, and TREK-1 channel proteins in hippocampal sections. Coronal hippocampal sections were immunofluorescently labeled for one of the three K2P channel proteins, namely, TASK-1 (B, F), TWIK-1 (J), and TREK-1 (N), GLAST, (A, E, I, M), and NeuN (C) or GFAP (G, K, O). Shown are single confocal planes taken in the CA1 pyramidal cell layer (A–D), or the stratum radiatum (E–P). TASK-1 immunoreactivity was present in NeuN-immunoreactive pyramidal neurons (A–D) and to a lesser extent in GFAP- and GLAST-immunoreactive astrocytes (E–H). Note that the TASK-1 immunoreactivity overlaps with that for GFAP and is within the GLAST outline of the astrocyte soma (E–H). Compared with anti-TASK-1, anti-TWIK-1 and TREK-1 bound more in the neuropil, in a similar manner to anti-GLAST. These antibodies also labeled the GFAP(+) somata (see merged images L and P). The scale bar in D represents 10 μm and applies to all images in this figure.

References

    1. Amzica F, Massimini M. Glial and neuronal interactions during slow wave and paroxysmal activities in the neocortex. Cereb Cortex. 2002;12:1101–1113. - PubMed
    1. Bergles DE, Jahr CE. Synaptic activation of glutamate transporters in hippocampal astrocytes. Neuron. 1997;19:1297–1308. - PubMed
    1. Butt AM, Kalsi A. Inwardly rectifying potassium channels (Kir) in central nervous system glia: a special role for Kir4.1 in glial functions. J Cell Mol Med. 2006;10:33–44. - PMC - PubMed
    1. Cahoy JD, Emery B, Kaushal A, Foo LC, Zamanian JL, Christopherson KS, Xing Y, Lubischer JL, Krieg PA, Krupenko SA, Thompson WJ, Barres BA. A transcriptome database for astrocytes, neurons, and oligodendrocytes: a new resource for understanding brain development and function. J Neurosci. 2008;28:264–278. - PMC - PubMed
    1. D'Ambrosio R, Wenzel J, Schwartzkroin PA, McKhann GM, 2nd, Janigro D. Functional specialization and topographic segregation of hippocampal astrocytes. J Neurosci. 1998;18:4425–4438. - PMC - PubMed

Publication types

MeSH terms