

Modelling transcriptional regulation with a mixture of factor analyzers and variational Bayesian expectation maximization
- PMID: 19572011
- PMCID: PMC3171433
- DOI: 10.1155/2009/601068
Modelling transcriptional regulation with a mixture of factor analyzers and variational Bayesian expectation maximization
Abstract
Understanding the mechanisms of gene transcriptional regulation through analysis of high-throughput postgenomic data is one of the central problems of computational systems biology. Various approaches have been proposed, but most of them fail to address at least one of the following objectives: (1) allow for the fact that transcription factors are potentially subject to posttranscriptional regulation; (2) allow for the fact that transcription factors cooperate as a functional complex in regulating gene expression, and (3) provide a model and a learning algorithm with manageable computational complexity. The objective of the present study is to propose and test a method that addresses these three issues. The model we employ is a mixture of factor analyzers, in which the latent variables correspond to different transcription factors, grouped into complexes or modules. We pursue inference in a Bayesian framework, using the Variational Bayesian Expectation Maximization (VBEM) algorithm for approximate inference of the posterior distributions of the model parameters, and estimation of a lower bound on the marginal likelihood for model selection. We have evaluated the performance of the proposed method on three criteria: activity profile reconstruction, gene clustering, and network inference.
Figures
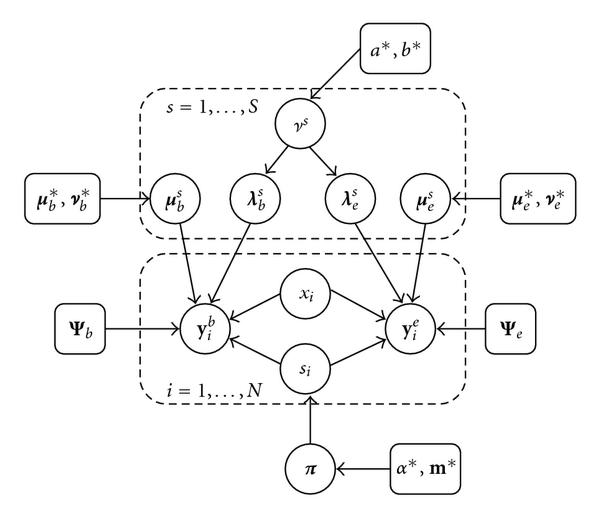
 components (factor analyzers), each with their own parameters
  and
and  , are used to model the expression profiles
  and TF binding profiles
  of
of  genes. The factor loadings
  have a zero-mean Gaussian prior distribution, whose precision hyperparameters
  are given a gamma distribution determined by
  and
and  . The analyzer displacements
  and
and  have Gaussian priors determined by the hyperparameters
  and
and  , respectively. The indicator variables
  select one out of
  factor analyzers, and the associated latent variables or factors
  have normal prior distributions. The indicator variables
  are given a multinomial distribution, whose parameter vector
  , the so-called mixture proportions, have a conjugate Dirichlet prior with hyperparameters
  .
.  and
and  are the diagonal covariance matrices of the Gaussian noise in the expression and binding profiles, respectively. A dashed rectangle denotes a plate, that is an iid repetition over the genes
  or the mixture components
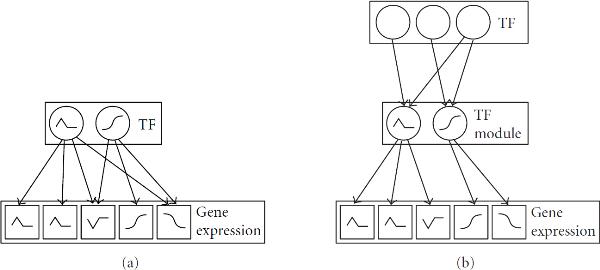
  , respectively. The biological interpretation of the model is as follows.
  represents the composition of the
  th transcriptional module, that is, it indicates which TFs bind cooperatively to the promoters of the regulated genes.
  allows for perturbations that result, for example, from the temporary inaccessibility of certain binding sites or a variability of the binding affinities caused by external influences.
  is the background gene expression profile.
  represents the activity profile of the
  th transcriptional module, which modulates the expression levels of the regulated genes.
  describes the gene-specific susceptibility to transcriptional regulation, that is, to what extent the expression of the
  th gene is influenced by the binding of a transcriptional module to its promoter. A complete description of the model can be found in Section 3.
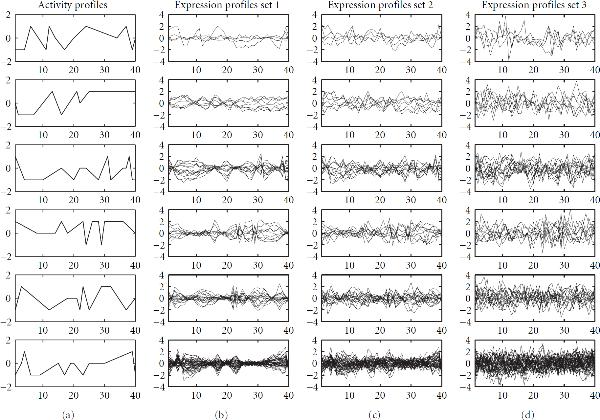
 and
and  . The vertical axes show the activity levels (a) or relative log gene expression ratios (other panels), respectively, which are plotted against 40 hypothetical experiments or time points, represented by the horizontal axes.
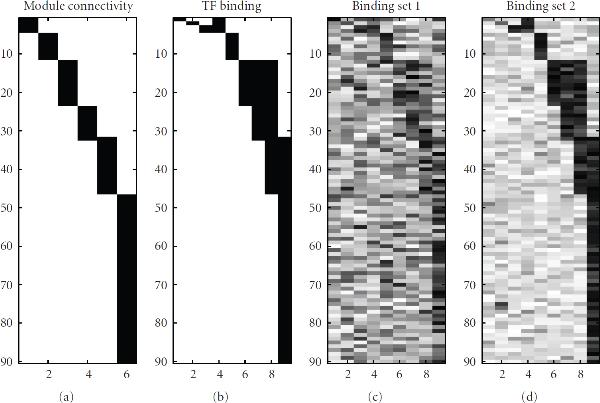
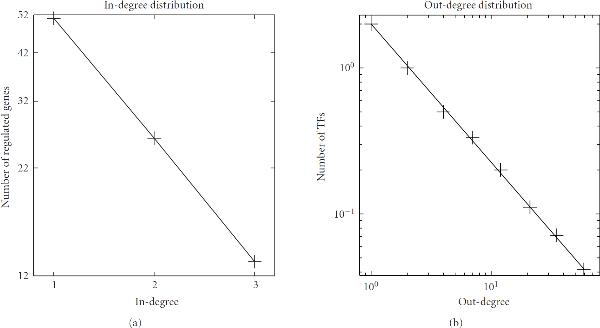
 TFs follows an exponential distribution of
  for in-degree
  . (b) The departing connectivity distribution (out-degree distribution). The number of TFs per
  follows the power-law distribution of
  for out-degree
  . Note that an exponential distribution is indicated by a linear relationship between
  and
and  in a log-linear representation (a), whereas a distribution consistent with the power law is indicated by a linear dependence between
  and
and  in a double logarithmic representation (b).
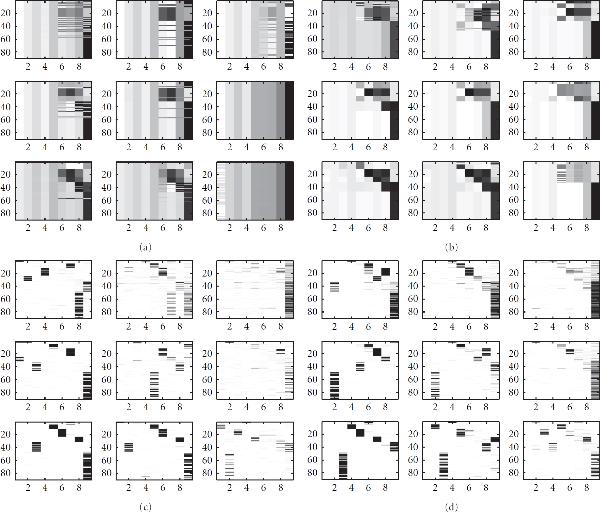
 and
and  . See Section 4.1 for further details.
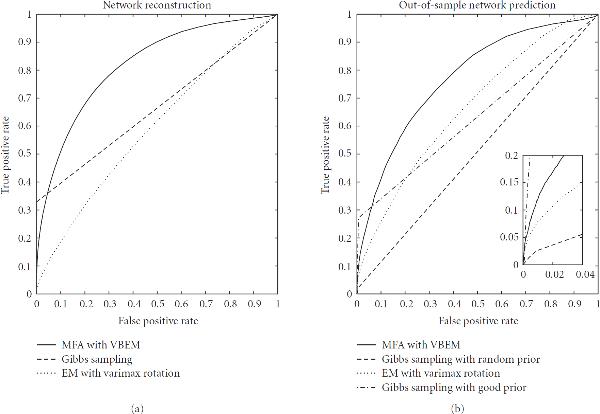
 : a random prior, where for each gene 11 randomly chosen elements in the matrix were nonzero (dashed line); and a "good" prior, where the nonzero elements in
  were chosen according to Teixeira et al. [38] subject to the maximum connectivity constraint described in the text (dash-dotted line).
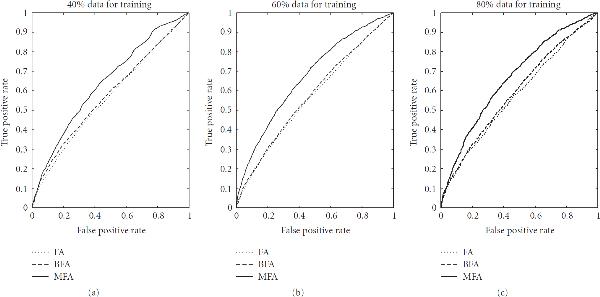
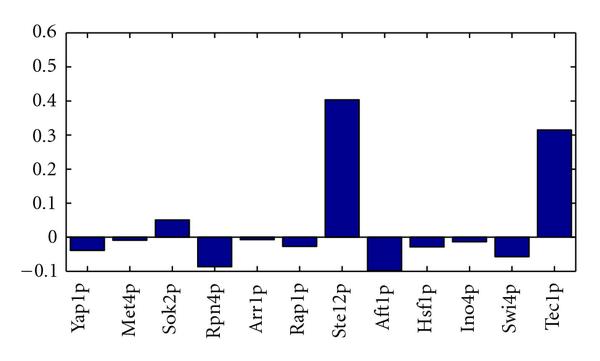
 ) found with MFA-VBEM for the yeast data. The figure shows a plot of
  , plotted on the vertical axis against the 12 TFs involved in the study. As explained in the caption of Figure 2,
  indicates the composition of the
  th TF module. It is clearly seen that this TF module is dominated by two TFs, Ste12 and Tec1, and thereby corresponds to a well-established module reported in the literature [51].
References
LinkOut - more resources
Full Text Sources
