Comparative Study
. 2009 Jul;102(1):97-110.
doi: 10.1160/TH08-08-0513.

Immune versus thrombotic stimulation of platelets differentially regulates signalling pathways, intracellular protein-protein interactions, and alpha-granule release

Affiliations
Comparative Study

Immune versus thrombotic stimulation of platelets differentially regulates signalling pathways, intracellular protein-protein interactions, and alpha-granule release

Sybille Rex et al. Thromb Haemost. 2009 Jul.

Abstract

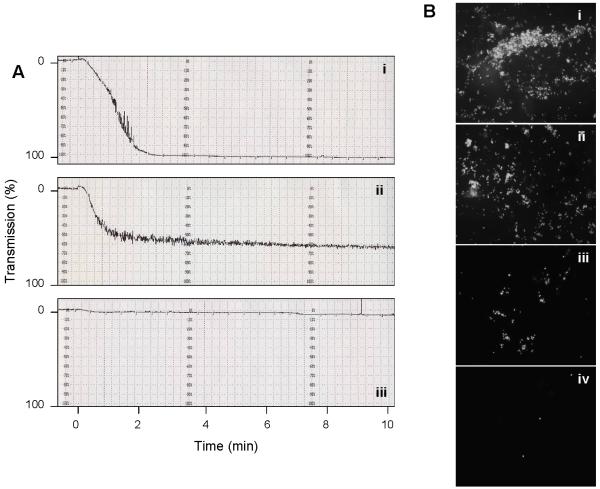
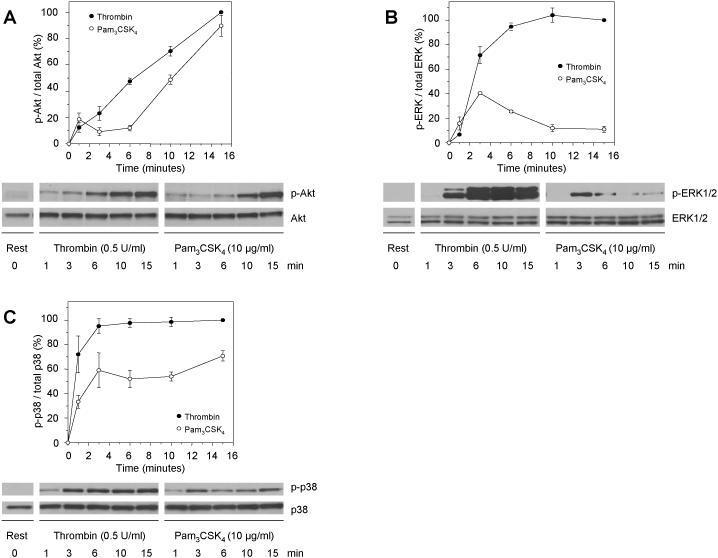
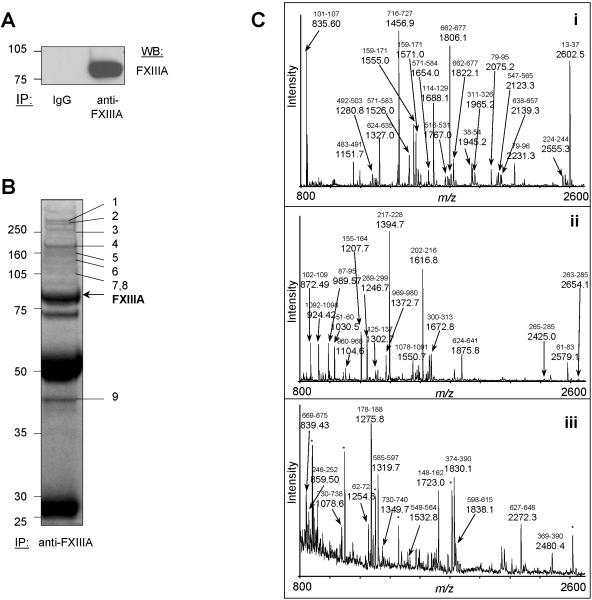
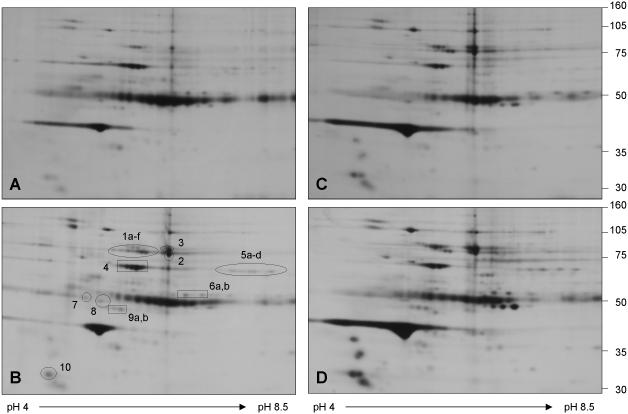
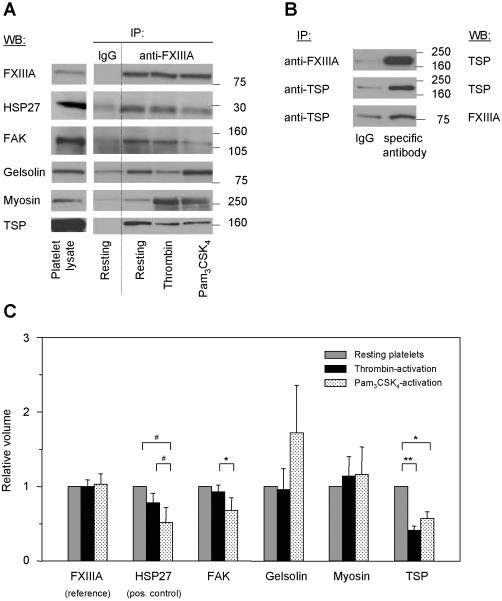
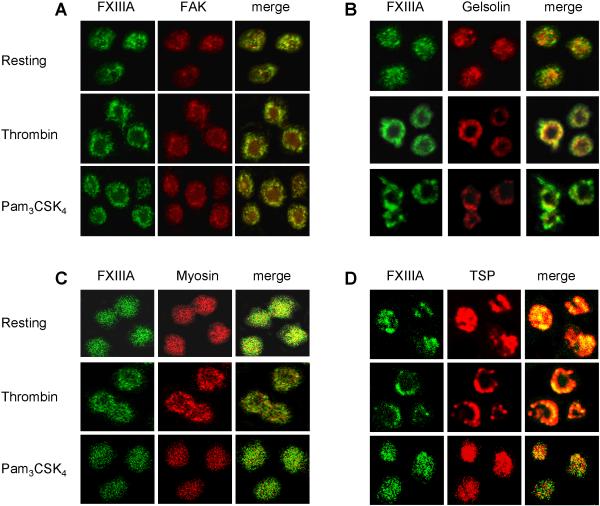
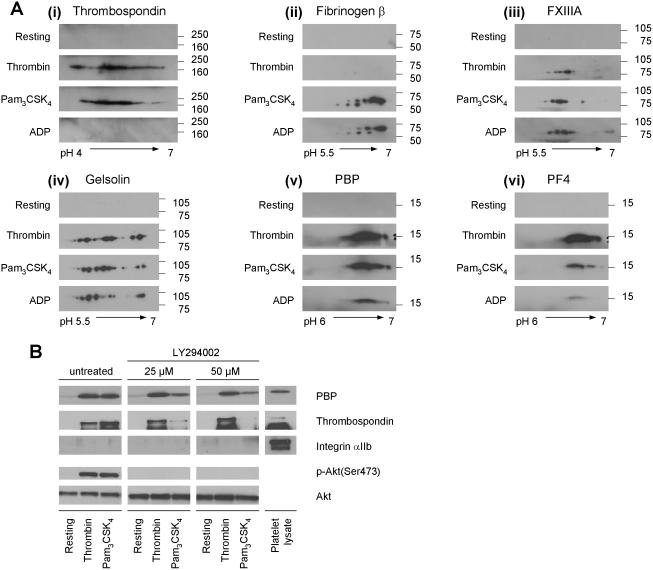
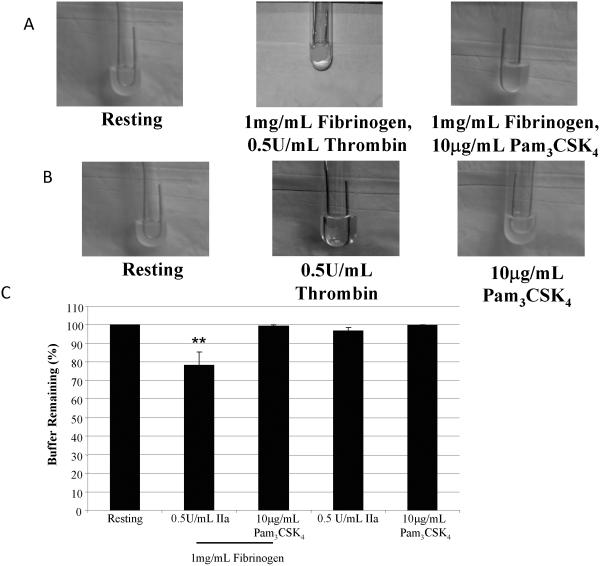
In addition to haemostasis, platelets mediate inflammation and clearance of bacteria from the bloodstream. As with platelet-platelet interactions, platelet-bacteria interactions involve cytoskeletal rearrangements and release of granular content. Stimulation of the immune Toll-like receptor 2 (TLR2) on the platelet surface, activates phosphoinositide-3-kinase (PI3K) and causes platelet activation and platelet-dependent thrombosis. It remains unknown if platelet activation by immune versus thrombotic pathways leads to the differential regulation of signal transduction, protein-protein interactions, and alpha-granule release, and the physiological relevance of these potential differences. We investigated these processes after immune versus thrombotic platelet stimulation. We examined selected signalling pathways and found that phosphorylation kinetics of Akt, ERK1/2 and p38 differed dramatically between agonists. Next, we investigated platelet protein-protein interactions by mass spectrometry (MS)-based proteomics specifically targeting cytosolic factor XIIIa (FXIIIa) because of its function as a cytoskeleton-crosslinking protein whose binding partners have limited characterisation. Four FXIIIa-binding proteins were identified, two of which are novel interactions: FXIIIa-focal adhesion kinase (FAK) and FXIIIa-gelsolin. The binding of FAK to FXIIIa was found to be altered differentially by immune versus thrombotic stimulation. Lastly, we studied the effect of thrombin versus Pam(3)CSK(4) stimulation on alpha-granule release and observed differential release patterns for selected granule proteins and decreased fibrin clot formation compared with thrombin. The inhibition of PI3K caused a decrease in protein release after Pam(3)CSK(4)- but not after thrombin-stimulation. In summary, stimulation of platelets by either thrombotic or immune receptors leads to markedly different signalling responses and granular protein release consistent with differential contribution to coagulation and thrombosis.


Figures

Figure 1
Figure 1. Platelet aggregation curves and platelet adhesion to collagen
(A) Washed platelets were activated under stirring conditions with (i) 0.5 U/mL thrombin, (ii) 10 μg/mL Pam3CSK4 and (iii) 10 μM ADP, respectively. Platelet aggregation was measured for 12 min by light transmission in an aggregometer and repeated four times. A representative curve for each agonist is shown where aggregation had progressed to 100% (i), 66% (ii) and 6% (iii), respectively, at the 12-min time point. (B) Platelet adhesion to a collagen-coated cover slip was measured in a flow chamber for washed platelets activated for 10 min with 0.5 U/mL thrombin (i), 10 μg/mL Pam3CSK4 (ii), 10 μM ADP (iii), and for unstimulated platelets (iv), respectively, demonstrating agonist-dependent differences in the induction of platelet adhesion. Images were taken at 20X magnification.
Figure 2
Figure 2. Differential phosphorylation kinetics for Akt, ERK1/2 and p38 after platelet activation with thrombin or Pam3CSK4
Platelets were activated with 0.5 U/mL thrombin (closed circles) or 10 μg/mL Pam3CSK4 (open circles) for the indicated amount of time, lysates were blotted for (A) phospho-Akt(Ser473) and total Akt, (B) phospho-ERK1/2(Thr202/Tyr204) and total ERK1/2, and (C) phospho-p38(Thr180/Tyr182) and total p38. Protein bands were quantified by densitometry and normalized to the protein signal in resting platelets. Error bars indicate the standard error of the mean of 3 to 4 experiments.
Figure 3
Figure 3. Immunoprecipitation and 1D-gel separation of FXIIIa-associated proteins followed by tryptic digestion, MALDI-TOF characterization and PMF assignment of immunoprecipitated proteins
(A) A specific signal was obtained for FXIIIa after immunoprecipitation from resting platelet lysates and immunoblotting (lane “anti-FXIIIa”) compared to the non-specific isotypic control (lane “IgG”). (B) FXIIIa was immunoprecipitated from resting platelet lysate at an antibody:protein ratio of 1:80. The immunoprecipitate was separated by 1D-GE and stained with Coomassie Blue. Shown are all proteins precipitated with the anti-FXIIIa sheep antibody. All distinguishable gel bands were excised, then subjected to tryptic in-gel digestion, and analyzed by MALDI-TOF MS and PMF. FXIIIa was identified as marked. All other proteins were assigned as indicated: 1-myosin, 2-talin, 3-filamin, 4-thrombospondin, 5-vinculin, 6-integrin αIIb, 7-α-actinin, 8-FAK, and 9-actin γ (for details, see Table 1). Experiments in (A) and (B) were repeated three times. IB indicates immunoblot. (C) MALDI-TOF mass spectra were obtained after tryptic in-gel digestion of excised protein bands/spots and were analyzed by PMF. (i) FXIIIa, (ii) thrombospondin, and (iii) gelsolin. Peaks of major peptide ions, which are derived from the identified protein, are labeled with their m/z values. The corresponding amino acid interval of the assigned peptide is indicated above the m/z value (small font). Abundant but unassignable ions are labeled with <*> symbols.
Figure 4
Figure 4. Immunoprecipitation and 2D-gel separation of FXIIIa-associated proteins followed by tryptic digestion and MALDI-TOF MS for protein identification
FXIIIa was immunoprecipitated from lysates of resting and activated platelets at an 1:250 antibody:protein ratio and each immunoprecipitate was subjected to 2D-GE (pI 3-10). A representative set of silver-stained gels is shown. (A) A control immunoprecipitation was performed with a non-specific isotypic antibody for resting platelet lysate. FXIIIa-associated proteins were immunoprecipitated with an anti-FXIIIa antibody (B) from resting platelets, (C) from thrombin-activated platelets (0.5 U/mL, 15 min) and (D) from Pam3CSK4-activated platelets (10 μg/mL, 15 min), respectively. Proteins present in gel spots in panel (B) were identified by tryptic in-gel digestion, MALDI-TOF MS and PMF analysis. The proteins were assigned as: 1(a-f) and 2-FXIIIa; 3-gelsolin; 4-albumin; 5(a-d)-fibrinogen α; 6(a,b)-fibrinogen β; 7-tubulin α; 8-tubulin β; 9(a,b)-fibrinogen γ; and 10-tropomyosin α4. Details of the assignments are given in Table 1. The train of spots at 50 kDa in all four gels corresponds to the heavy chain of the precipitating antibody. This experiment was repeated three times.
Figure 5
Figure 5. Validation of FXIIIa-binding proteins by immunoblotting and coimmunoprecipitation, and quantitative analysis of the FXIIIa-protein interactions
(A) Proteins identified by 1D- and 2D-GE, MALDI-TOF MS and PMF analysis were tested by immunoblotting for the specificity and intensity of their FXIIIa-interaction. FXIIIa was immunoprecipitated at an 1:250 antibody:protein ratio from lysates of resting and activated platelets (all lanes “anti-FXIIIa”). As control, a non-specific antibody was used (lanes “IgG”, “Resting”). All immunoprecipitates were separated by 1D-GE, transferred and blotted for the identified proteins listed in Table 1. Here, representative immunoblots for the four specific FXIIIa-binding proteins only are shown. HSP27, as a known FXIIIa-interacting protein, was included as positive control. Lane “Platelet lysate” shows the position of the protein in the total lysate of resting platelets. (B) The interaction between FXIIIa and thrombospondin was tested by co-immunoprecipitation and immunoblotting in resting platelets. The FXIIIa-immunoprecipitate was separated by 1D-GE and blotted for thrombospondin (top image). Thrombospondin was immunoprecipitated with a specific antibody, separated by 1D-GE and blotted first for thrombospondin (middle image) and then for FXIIIa (bottom image). As control, corresponding non-specific antibodies (lanes “IgG”) were used. (C) To determine agonist-induced changes in FXIIIa-protein interactions, quantitative analysis of the immunoblot images in Figure 5A was performed by densitometry for all lanes “anti-FXIIIa”. Band intensities were quantified for each protein, then normalized to the band intensity of FXIIIa and to the protein's band intensity in resting platelets (see also Table 2). ** indicates p < 0.01; *, p < 0.05; #, p = 0.07; IP, immunoprecipitation; IB, immunoblot; TSP, thrombospondin; and FAK, focal adhesion kinase.
Figure 6
Figure 6. Co-localization of FXIIIa with the four identified FXIIIa-binding proteins as determined by confocal microscopy
The interaction between FXIIIa and the four specific FXIIIa-binding proteins was tested for co-localization by confocal microscopy in resting platelets (upper row of each panel), thrombin-activated platelets (middle row) and Pam3CSK4-activated platelets (lower row), respectively. The first column in each panel shows FXIIIa labeled with an FITC-conjugated secondary antibody, the middle row corresponds to the interacting protein labeled with a Texas Red-conjugated secondary antibody, and the last row shows co-localization of both proteins as indicated by the yellow color in the merged image. Platelets were activated for 10-20 min with either 0.5 U/mL thrombin or 10 μg/mL Pam3CSK4, respectively. (A) FAK, (B) gelsolin, (C) myosin, and (D) thrombospondin (TSP). All images were taken at 100X magnification.
Figure 7
Figure 7. Differential release of α-granule proteins after platelet activation with thrombin, Pam3CSK4 or ADP, and differential inhibition of α-granule release by LY294002 after platelet activation with thrombin or Pam3CSK4
(A) Releasates from resting platelets and from platelets activated with 0.5 U/mL thrombin, 10 μg/mL Pam3CSK4, or 10 μM ADP, respectively, were tested by immunoblotting for selected released α-granule proteins. (i) Thrombospondin, (ii) fibrinogen β, (iii) FXIIIa, (iv) gelsolin, (v) platelet basic protein (PBP), and (vi) platelet factor 4 (PF4). Experiments were repeated up to three times for each protein. (B) Platelets were incubated with the PI3K-inhibitor LY294002 (0, 25 and 50 μM) for 30 min, then either left unstimulated (resting) or activated with thrombin (0.5 U/mL) or Pam3CSK4 (10 μg/mL) for 15 min. Immunoblotting for PBP and thrombospondin, as well as for integrin αIIb (to test for microvesicle contamination), phospho-Akt(Ser473) (to show PI3K inhibition) and total Akt (as lysate loading control) are shown.
Figure 8
Figure 8. Fibrin clot formation using washed platelets stimulated with thrombin or Pam3CSK4
Representative photographs (A) were taken of clots that formed in the presence or absence of 1 mg/mL fibrinogen upon stimulation with either 0.5 U/mL thrombin or 10 μg/mL Pam3CSK4. Bar graphs (B) show the percent buffer remaining that was calculated, as described in the Methods, in the presence or absence of fibrinogen. The average and standard error from 6 experiments are graphed. ** p<0.01 compared to resting platelets using an ANOVA analysis, followed by a Dunnett's post test.
Figure 9
Figure 9. Differential interactions of platelets with monocytes upon stimulation with thrombin or Pam3CSK4 using SEM
Bar graph (A) shows the percent of platelet-positive monocytes determined through flow cytometry of whole blood samples untreated (Resting) or treated with 0.5 U/mL thrombin or 10 μg/mL Pam3CSK4 for 10 minutes at room temperature. The average percent and standard error from 7 experiments are graphed. ** p<0.01 compared to Resting and Thrombin treatments using an ANOVA analysis, followed by a Bonferroni post test. Scanning electron micrographs (B) of control (no agonist) and samples treated with 0.5 U/mL thrombin or with 10μg/mL Pam3CSK4. Magnification at 15,000X.

References

    1. Beutler B. Innate immunity: an overview. Mol Immunol. 2004;40(12):845–59. - PubMed
    1. Akira S. Toll-like receptor signaling. J Biol Chem. 2003;278(40):38105–8. - PubMed
    1. Shiraki R, Inoue N, Kawasaki S, Takei A, Kadotani M, Ohnishi Y, et al. Expression of Toll-like receptors on human platelets. Thromb Res. 2004;113(6):379–85. - PubMed
    1. Cognasse F, Hamzeh H, Chavarin P, Acquart S, Genin C, Garraud O. Evidence of Toll-like receptor molecules on human platelets. Immunol Cell Biol. 2005;83(2):196–8. - PubMed
    1. Weyrich AS, Zimmerman GA. Platelets: signaling cells in the immune continuum. Trends Immunol. 2004;25(9):489–95. - PubMed

Publication types

MeSH terms