

doi: 10.1021/nl802929u.
Multiwavelength photoacoustic imaging and plasmon resonance coupling of gold nanoparticles for selective detection of cancer
Affiliations
- PMID: 19572747
- PMCID: PMC2898720
- DOI: 10.1021/nl802929u
Item in Clipboard
Multiwavelength photoacoustic imaging and plasmon resonance coupling of gold nanoparticles for selective detection of cancer
Nano Lett.
2009 Aug.
Abstract
Gold nanoparticles targeting epidermal growth factor receptor via antibody conjugation undergo molecular specific aggregation when they bind to receptors on cell surfaces, leading to a red shift in their plasmon resonance frequency. Capitalizing on this effect, we demonstrate the efficacy of the molecular specific photoacoustic imaging technique using subcutaneous tumor-mimicking gelatin implants in ex-vivo mouse tissue. The results of our study suggest that highly selective and sensitive detection of cancer cells is possible using multiwavelength photoacoustic imaging and molecular specific gold nanoparticles.
Figures
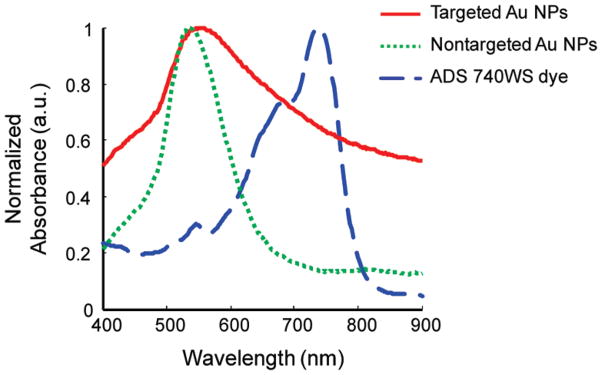
Normalized absorbance spectra of A431 cells labeled with anti-EGFR Au NPs (solid red line), A431 cells mixed with mPEG-SH coated Au NPs (dotted green line), and ADS740WS dye (dashed blue line).
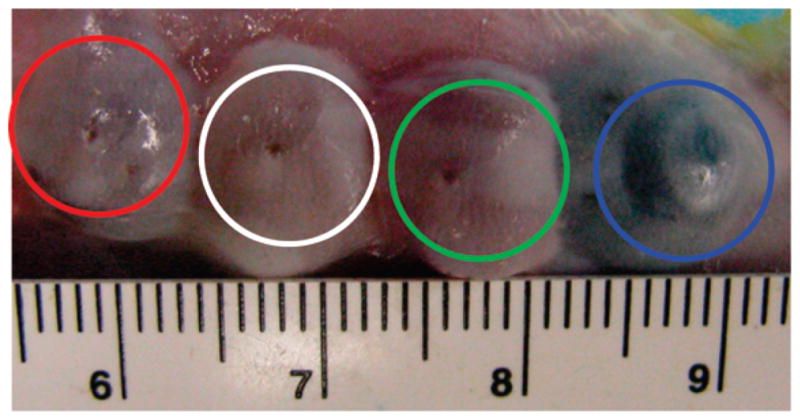
Photograph of the subcutaneous gelatin implants in mouse tissue ex-vivo. The gelatin implants containing the cells with targeted Au NPs, control A431 cells, A431 cells mixed with mPEG-SH coated Au NPs and NIR dye are shown in red, white, green, and blue insets respectively.
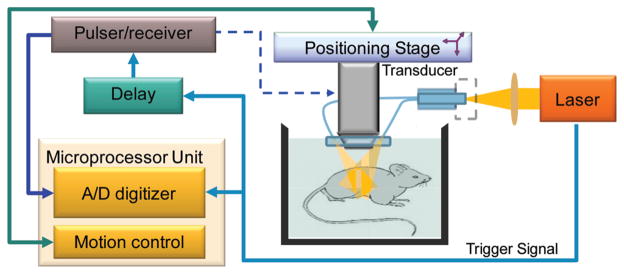
Block diagram of the combined ultrasound and photoacoustic imaging system.
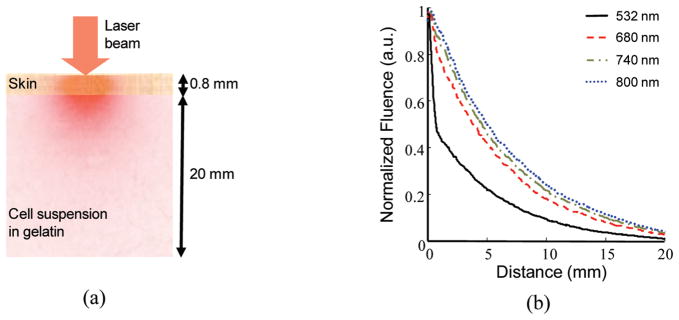
(a) Schematic representation of the two layer model used for MC simulations of mouse skin and underlying tissue. (b) The depth resolved fluence obtained from the MC simulations for different wavelength illumination.
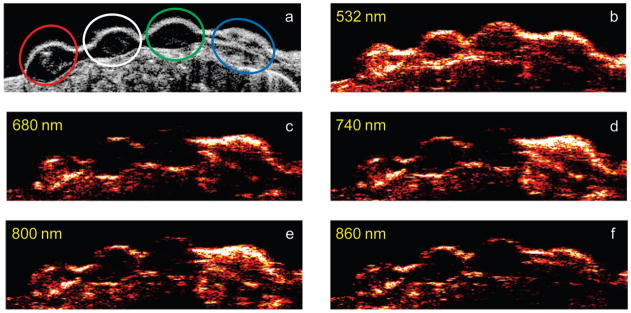
Ultrasound (a) and photoacoustic (b–f) images of gelatin implants in mouse tissue ex-vivo at laser illumination wavelength 532, 680, 740, 800, and 860 nm, respectively. The gelatin implants containing the cells with targeted Au NPs, control A431 cells, the A431 cells mixed with mPEG-SH coated Au NPs, and NIR dye are shown on the ultrasound image in red, white, green, and blue insets, respectively. The images measure 44 mm laterally and 11 mm axially.
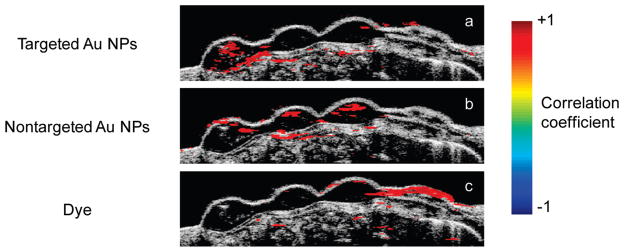
Correlation coefficient images overlaid on ultrasound image of the subcutaneous gelatin implants in mouse tissue ex-vivo. The correlation coefficient images were obtained by comparing multiwavelength photoacoustic images with optical spectra of (a) targeted Au NPs, (b) nontargeted Au NPs and (c) ADS740WS dye. Only correlation coefficient values greater than 0.75 are displayed in the images. The images measure 44 mm laterally and 9.1 mm axially.
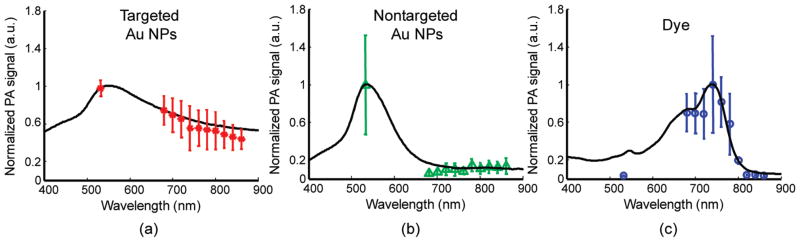
Comparison of absorption spectrum of (a) targeted Au NPs, (b) nontargeted Au NPs, and (c) ADS740WS dye obtained from multiwavelength photoacoustic images (data points) and spectrophotometer (solid line).
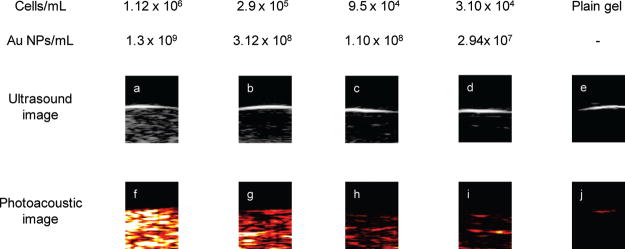
The ultrasound and photoacoustic images of cell/gelatin samples at different cell concentration. The photoacoustic images were obtained at 680 nm wavelength illumination. The images represent a 2 mm × 2.5 mm field of view.
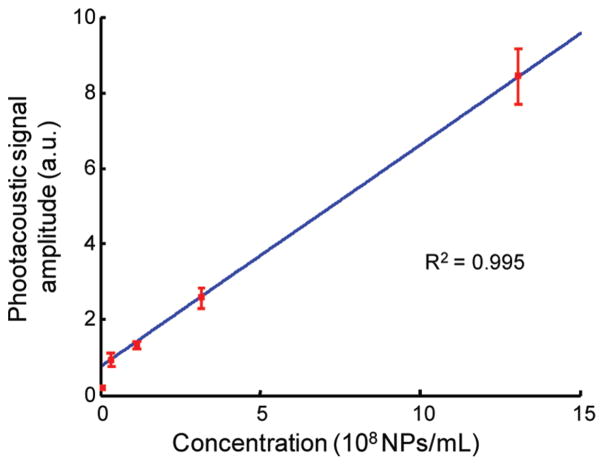
Graph depicting the change in photoacoustic signal amplitude with Au NPs concentration. The solid line represents the linear regression fit of the data with R2 equal to 0.995.
References
-
- Pope-Harman A, Cheng MM, Robertson F, Sakamoto J, Ferrari M. Med Clin North Am. 2007;91(5):899–927. - PubMed
-
- Sharma P, Brown S, Walter G, Santra S, Moudgil B. Adv Colloid Interface Sci. 2006;123–126:471–85. - PubMed
-
- Sunderland CJ, Steiert M, Talmadge JE, Derfus AM, Barry SE. Drug Dev Res. 2006;67:70–93.
-
- Weissleder R, Mahmood U. Radiology. 2001;219(2):316–33. - PubMed
-
- Wickline SA, Lanza GM. Circulation. 2003;107(8):1092–5. - PubMed
Publication types
MeSH terms
Substances
Grants and funding
LinkOut - more resources
Full Text Sources
Other Literature Sources
Medical
Research Materials
