Review
. 2009;8(1):Article28.
doi: 10.2202/1544-6115.1470. Epub 2009 Jun 9.

Extensions of sparse canonical correlation analysis with applications to genomic data

Affiliations
Review

Extensions of sparse canonical correlation analysis with applications to genomic data

Daniela M Witten et al. Stat Appl Genet Mol Biol. 2009.

Abstract

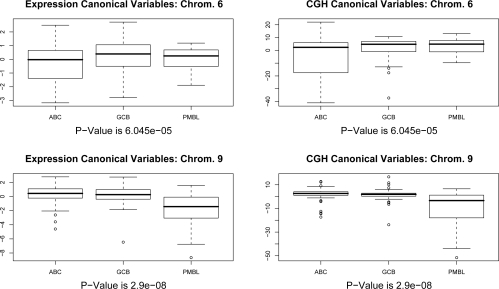
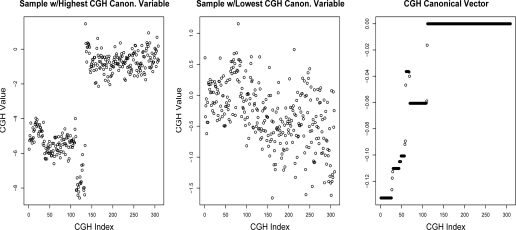
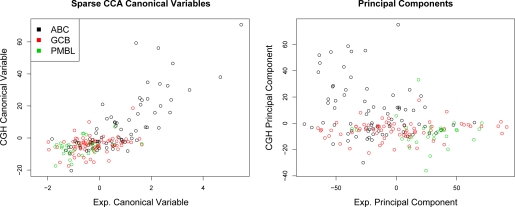
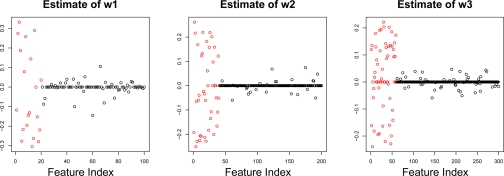
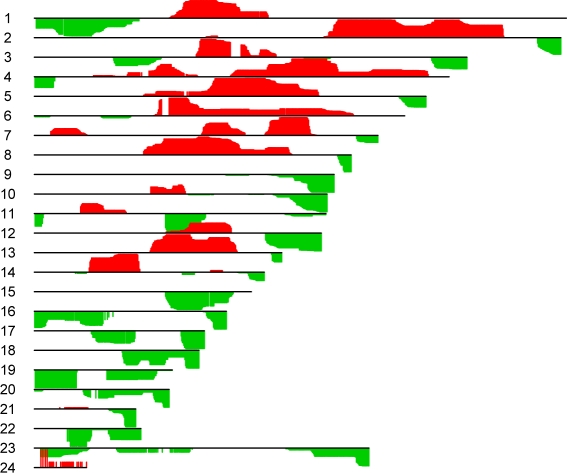
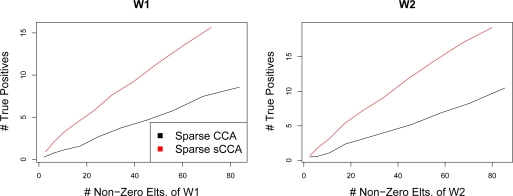
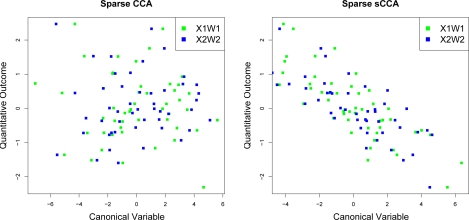
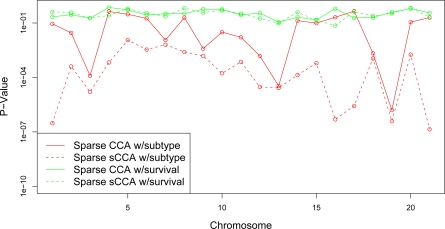
In recent work, several authors have introduced methods for sparse canonical correlation analysis (sparse CCA). Suppose that two sets of measurements are available on the same set of observations. Sparse CCA is a method for identifying sparse linear combinations of the two sets of variables that are highly correlated with each other. It has been shown to be useful in the analysis of high-dimensional genomic data, when two sets of assays are available on the same set of samples. In this paper, we propose two extensions to the sparse CCA methodology. (1) Sparse CCA is an unsupervised method; that is, it does not make use of outcome measurements that may be available for each observation (e.g., survival time or cancer subtype). We propose an extension to sparse CCA, which we call sparse supervised CCA, which results in the identification of linear combinations of the two sets of variables that are correlated with each other and associated with the outcome. (2) It is becoming increasingly common for researchers to collect data on more than two assays on the same set of samples; for instance, SNP, gene expression, and DNA copy number measurements may all be available. We develop sparse multiple CCA in order to extend the sparse CCA methodology to the case of more than two data sets. We demonstrate these new methods on simulated data and on a recently published and publicly available diffuse large B-cell lymphoma data set.


Figures

Figure 1:
Figure 1:
Sparse CCA was performed using CGH data on a single chromosome and all gene expression measurements. For chromosomes 6 and 9, the gene expression and CGH canonical variables, stratified by cancer subtype, are shown. It is clear that the values of the canonical variables differ by subtype. Pvalues reported are replicated from Table 1; they reflect the extent to which the canonical variables predict cancer subtype in a multinomial logistic regression model.
Figure 2:
Figure 2:
Sparse CCA was performed using CGH data on chromosome 9, and all gene expression measurements. The samples with the highest and lowest absolute values in the CGH canonical variable are shown, along with the canonical vector corresponding to the CGH data. As expected, the sample with the highest CGH canonical variable is highly correlated with the CGH canonical vector, and the sample with the lowest CGH canonical variable shows little correlation. The sample with highest CGH canonical variable is of subtype PMBL, and the sample with lowest canonical variable is of subtype ABC. The CGH data on chromosome 9 consists of 309 features, of which 111 have non-zero weights in the right-hand panel.
Figure 3:
Figure 3:
Sparse CCA and PCA were performed using CGH data on chromosome 3, and all gene expression measurements. The resulting canonical variables and principal components are shown. The CGH and expression canonical variables are highly correlated with each other. Both sparse CCA and PCA result in some separation between the three DLBCL subtypes, although PCA results in better separation because the first principal components of the CGH and expression data are less correlated with each other.
Figure 4:
Figure 4:
Three data sets X1, X2, and X3 are generated under a simple model, and sparse mCCA is performed. The resulting estimates of w1, w2, and w3 are fairly accurate at distinguishing between the elements of wi that are truly nonzero (red) and those that are not (black). From left to right, the three canonical vectors shown have 57, 67, and 92 nonzero elements.
Figure 5:
Figure 5:
Sparse mCCA was performed on the DLBCL copy number data, treating each chromosome as a separate “data set”, in order to identify genomic regions that are coamplified and/or codeleted. The canonical vectors w1, ..., w24 are shown. Positive values of the canonical vectors are shown in red, and negative values are in green.
Figure 6:
Figure 6:
Sparse CCA and sparse sCCA were performed on a toy example, for a range of values of the tuning parameters in the sparse CCA criterion. The number of true positives in w1 and w2 is shown as a function of the number of nonzero elements in the estimates of the canonical vectors.
Figure 7:
Figure 7:
Sparse CCA and sparse sCCA were performed on a toy example. The canonical variables obtained using sparse sCCA are highly correlated with the outcome; those obtained using sparse CCA are not.
Figure 8:
Figure 8:
On a training set, sparse CCA and sparse sCCA were performed using CGH measurements on a single chromosome, and all available gene expression measurements. The resulting test set canonical variables were used to predict survival time and DLBCL subtype. Median p-values (over training set / test set splits) are shown.

References

    1. Alizadeh A, Eisen M, Davis RE, Ma C, Lossos I, Rosenwald A, Boldrick J, Sabet H, Tran T, Yu X, Powell J, Marti G, Moore T, Hudson J, Lu L, Lewis D, Tibshirani R, Sherlock G, Chan W, Greiner T, Weisenburger D, Armitage K, Warnke R, Levy R, Wilson W, Grever M, Byrd J, Botstein D, Brown P, Staudt L. ‘Distinct types of diffuse large B-cell lymphoma identified by gene expression profiling’. Nature. 2000;403:503–511. doi: 10.1038/35000501. - DOI - PubMed
    1. Bair E, Hastie T, Paul D, Tibshirani R. ‘Prediction by supervised principal components’. J Amer Statist Assoc. 2006;101:119–137. doi: 10.1198/016214505000000628. - DOI
    1. Bair E, Tibshirani R. ‘Semi-supervised methods to predict patient survival from gene expression data’. PLOS Biology. 2004;2:511–522. doi: 10.1371/journal.pbio.0020108. - DOI - PMC - PubMed
    1. Gifi A. Nonlinear multivariate analysis. Wiley, Chichester; England: 1990.
    1. Hotelling H. ‘Relations between two sets of variates’. Biometrika. 1936;28:321–377.

Publication types