Review
. 2009;8(1):Article29.
doi: 10.2202/1544-6115.1454. Epub 2009 Jun 19.

A non-homogeneous hidden-state model on first order differences for automatic detection of nucleosome positions

Affiliations
Review

A non-homogeneous hidden-state model on first order differences for automatic detection of nucleosome positions

Pei Fen Kuan et al. Stat Appl Genet Mol Biol. 2009.

Abstract

The ability to map individual nucleosomes accurately across genomes enables the study of relationships between dynamic changes in nucleosome positioning/occupancy and gene regulation. However, the highly heterogeneous nature of nucleosome densities across genomes and short linker regions pose challenges in mapping nucleosome positions based on high-throughput microarray data of micrococcal nuclease (MNase) digested DNA. Previous works rely on additional detrending and careful visual examination to detect low-signal nucleosomes, which may exist in a subpopulation of cells. We propose a non-homogeneous hidden-state model based on first order differences of experimental data along genomic coordinates that bypasses the need for local detrending and can automatically detect nucleosome positions of various occupancy levels. Our proposed approach is applicable to both low and high resolution MNase-Chip and MNase-Seq (high throughput sequencing) data, and is able to map nucleosome-linker boundaries accurately. This automated algorithm is also computationally efficient and only requires a simple preprocessing step. We provide several examples illustrating the pitfalls of existing methods, the difficulties of detrending the observed hybridization signals and demonstrate the advantages of utilizing first order differences in detecting nucleosome occupancies via simulations and case studies involving MNase-Chip and MNase-Seq data of nucleosome occupancy in yeast S. cerevisiae.


Figures
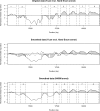
Figure 1:
Figure 1:
Typical characteristics of MNase-chip nucleosome occupancy data from Yuan et al. (2005). Top panel is the original normalized data tiling a region in chromosome 3. The vertical black solid lines represent probes identified as nucleosome state according to “hand picked” annotation in Yuan et al. (2005). The vertical dotted lines are boundaries separating nucleosomelinker states. Gray horizontal lines at y=2.5 are the nucleosomes inferred. Middle panel is the corresponding smoothed data by taking moving averages in a window size of 3 probes and the dots are the first order differences. Bottom panel is based on annotation from our proposed NHSM.
Figure 2:
Figure 2:
State transition representation in NHSM. Ni represents nucleosome states, Li represents linker states, BN and BL represent linker-nucleosome and nucleosome-linker boundaries, respectively.
Figure 3:
Figure 3:
State transition representation in NHSM. An equivalent representation of the discrete duration density in the hidden states of Figure 2(a).
Figure 4:
Figure 4:
Graphical model representation of the feedback structure. The directionality of the edges dictates the dependence structure. This model implies that the transition from Qt to Qt+1 depends on Zt.
Figure 5:
Figure 5:
HMM architecture in Yuan et al. (2005). D1-D9 represent delocalized high nucleosomes, N1-N8 represent well-positioned high nucleosomes, DL1-DL9 represent delocalized low-signal nucleosomes, NL1-NL8 represent well-positioned low-signal nucleosomes and L represents a linker probe.
Figure 6:
Figure 6:
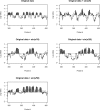
An example of simulated data from Simulation I. The dotted line in the top right panel is the trend line. Bottom left panel is the data detrended by comparing peak and trough within a window size of 7 probes. Bottom right panel is the smoothed data. Black vertical lines represent true nucleosome probes.
Figure 7:
Figure 7:
Trend lines in the simulated data. The periodicity of the sinusoidal trend lines is varied in each simulation scenario.
Figure 8:
Figure 8:
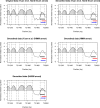
An example of simulated data from Simulation II. Middle panel is the data detrended by comparing peak and trough within a window size of 7 probes. Bottom panel is the smoothed data. Black vertical lines represent nucleosome probes.
Figure 9:
Figure 9:
Simplified state transition representation in NHSM for MNase-chip data of Yuan et al. (2005). We assume that d(N2a) = d(N2c).
Figure 10:
Figure 10:
Nucleosome occupancy in HIS3 promoter. Top left panel is the original normalized data tiling HIS3 promoter region and using annotation based on“hand picked” nucleosomes in Yuan et al. (2005). Top right panel is similar to top left panel except that we plot the corresponding smoothed data. Middle left and right panels are based on SHMM annotation in Yuan et al. (2005) and ordinary HMM annotation, respectively. Bottom left panel is based on annotation from our proposed NHSM. Black horizontal line between positions 721871 and 721971 in each panel is the low nucleosome identified by Yuan et al. (2005) after further detrending. Red and blue horizontal lines are the nucleosome regions identified independently by Lee et al. (2007) and Shivaswamy et al. (2008), respectively.
Figure 11:
Figure 11:
An example of “hand picked” low-signal nucleosome for a region in chromosome 3. Black horizontal line between positions 49841 and 49961 is an example of “hand picked” low-signal nucleosome by Yuan et al. (2005). Red and blue horizontal lines are the nucleosome regions identified independently by Lee et al. (2007) and Shivaswamy et al. (2008). The additional detrending by Yuan et al. (2005) after SHMM decoding still misses some of the low-signal nucleosomes, but NHSM is able to capture them.
Figure 12:
Figure 12:
Nucleosome occupancy for a region in chromosome 3 in Yuan et al. (2005). Top panels are based on “hand picked” annotation. Bottom left panel is the detrended data by comparing peak and trough within a window size of 7 probes. Bottom right panel is based on annotation from our proposed model. The spurious “bumps” at positions 103400 (between nucleosomes 1 and 2) and 104400 (between nucleosomes 6 and 7) in the top panels are not picked up by our model. The annotation based on HMMD deviates significantly from the “hand picked” annotation.
Figure 13:
Figure 13:
Examples of “hand picked” annotations in Yuan et al. (2005). Left panels are original data based on the “hand picked” annotations in Yuan et al. (2005) for two regions in chromosomes 5 and 7, respectively. Right panels are the smoothed data for similar regions. Although the “hand picked” nucleosomes are reliable, there are still some uncertainties in picking the boundaries of nucleosome-linker, for instance between nucleosomes 2 and 3 in the top panels and between nucleosomes 1 and 2 in the bottom panels.
Figure 14:
Figure 14:
Receiver operating characteristic (ROC) curve. Comparison of various methods on MNase-chip data from Yuan et al. (2005) using the set of “hand picked” annotated low-signal nucleosomes as the true positive set.
Figure 15:
Figure 15:
Nucleosome occupancy at CHA1 (top row) and HIS3 (bottom row) promoter. Red horizontal lines at y =1.5 are the nucleosome annotation from Lee et al. (2007). Blue horizontal lines at y =2 are the nucleosome annotation from Shivaswamy et al. (2008). Green horizontal lines at y =2.5 are the nucleosome annotation from NHSM. Vertical dotted lines in the left, middle, and right columns are boundaries separating nucleosome-linker states from Lee et al. (2007), Shivaswamy et al. (2008), and NHSM respectively, as given in the header. Orange lines are the computed Ot’s for each mid-probe.
Figure 16:
Figure 16:
Illustration of obtaining reads for each genomic position in ChIP-Seq data. White rectangles are reads mapped to the plus strand and the black rectangles are reads mapped to the minus strand. Panel B shows the extended reads (150 base pairs). Panel C shows the total read for each genomic position.
Figure 17:
Figure 17:
Nucleosome occupancy at CHA1 (top row) and HIS3 (bottom row) promoter. Red horizontal lines at y =20 are the nucleosome annotation from Lee et al. (2007). Blue horizontal lines at y =25 are the nucleosome annotation from Shivaswamy et al. (2008). Green horizontal lines at y =30 are the nucleosome annotation from NHSM. Vertical dotted lines in the left, middle, and right columns are boundaries separating nucleosome-linker states from Shivaswamy et al. (2008), Lee et al. (2007), and NHSM respectively, as given in the header. Orange lines are the computed Ot’s for each mid-probe.
Figure 18:
Figure 18:
Nucleosome occupancy in CHA1 promoter. Different panels illustrate various smoothing algorithms. Vertical dotted lines are boundaries separating nucleosome-linker states from Lee et al. (2007). Red horizontal lines at y =1.5 are the nucleosome annotations from Lee et al. (2007). Blue horizontal lines at y =2 are the nucleosome annotations from Shivaswamy et al. (2008).
Figure 19:
Figure 19:
Nucleosome occupancy in HIS3 promoter. Different panels illustrate various smoothing algorithms. Vertical dotted lines are boundaries separating nucleosome-linker states from Lee et al. (2007). Red horizontal lines at y =1.5 are the nucleosome annotations from Lee et al. (2007). Blue horizontal lines at y = 2 are the nucleosome annotations from Shivaswamy et al. (2008).
Figure 20:
Figure 20:
Nucleosome occupancy in SAC7 promoter. Different panels illustrate various smoothing algorithms. Vertical dotted lines are boundaries separating nucleosome-linker states from Lee et al. (2007). Red horizontal lines at y = 1.5 are the nucleosome annotations from Lee et al. (2007). Blue horizontal lines at y =2 are the nucleosome annotations from Shivaswamy et al. (2008).
Figure 21:
Figure 21:
Increasing resolution of tiling arrays via pseudo probes. This is an illustration on how we can adapt the idea of Yassour et al. (2008) in creating a pseudo MNase-Chip data from constant low resolution tiling arrays with overlapping probe design. Yi−1, Yi and Yi+1 are the log base 2 ratios for 3 consecutive probes, whereas the Pij’s are the resulting pseudo probes by partitioning each Yi into 5 segments. Ri’s are the resulting pseudo probes in the generated pseudo tiling array with higher resolution. The log base 2 ratios for this pseudo tiling array are obtained by averaging the original log base 2 ratios of the overlapping pseudo probes.

References

    1. Albert I, Mavrich T, Tomsho L, Qi J, Zanton S, Schuster S, Pugh B. Translational and rotational settings of H2A.Z nucleosomes across the saccharomyces cerevisiae genome. Nature. 2007;446:572–576. doi: 10.1038/nature05632. - DOI - PubMed
    1. Bernstein B, Liu C, Humphrey E, Perlstein E, Schreiber S. Global nucleosome occupancy in yeast. Genome Biology. 2004;5(62) doi: 10.1186/gb-2004-5-9-r62. - DOI - PMC - PubMed
    1. Chakravarthy S, Park Y, Chodaparambil J, Edayathumangalam R, Luger K. Structure and dynamic properties of nucleosome core particles, FEBS Letters. 2006;579(4):895–898. - PubMed
    1. Ercan S, Carrozza MJ, Workman JL. Global nucleosome distribution and the regulation of transcription in yeast. Genome Biology. 2004;5(10) doi: 10.1186/gb-2004-5-10-243. doi:10.1186/gb–2004–5–10–243. - DOI - PMC - PubMed
    1. Johnson SM, Tan FJ, McCullough HL, Riordan DP, Fire AZ. Flexibility and constraint in the nucleosome core landscape of caenorhabditis elegans chromatin. Genome Research. 2006;16:1505–1516. doi: 10.1101/gr.5560806. - DOI - PMC - PubMed

Publication types

LinkOut - more resources