

MicroRNA expression profile in Lieber-DeCarli diet-induced alcoholic and methionine choline deficient diet-induced nonalcoholic steatohepatitis models in mice
- PMID: 19572984
- PMCID: PMC3753180
- DOI: 10.1111/j.1530-0277.2009.01007.x
MicroRNA expression profile in Lieber-DeCarli diet-induced alcoholic and methionine choline deficient diet-induced nonalcoholic steatohepatitis models in mice
Abstract
Background: Alcoholic and nonalcoholic steatohepatitis are leading causes of liver diseases worldwide. While of different etiology, these share common pathophysiological mechanisms and feature abnormal fat metabolism, inflammation and fibrosis. MicroRNAs (miRNA) are highly conserved noncoding RNAs that control gene expression at the post-transcriptional level either via the degradation of target mRNAs or the inhibition of translation. Each miRNA controls the expression of multiple targets; miRNAs have been linked to regulation of lipid metabolism and inflammation.
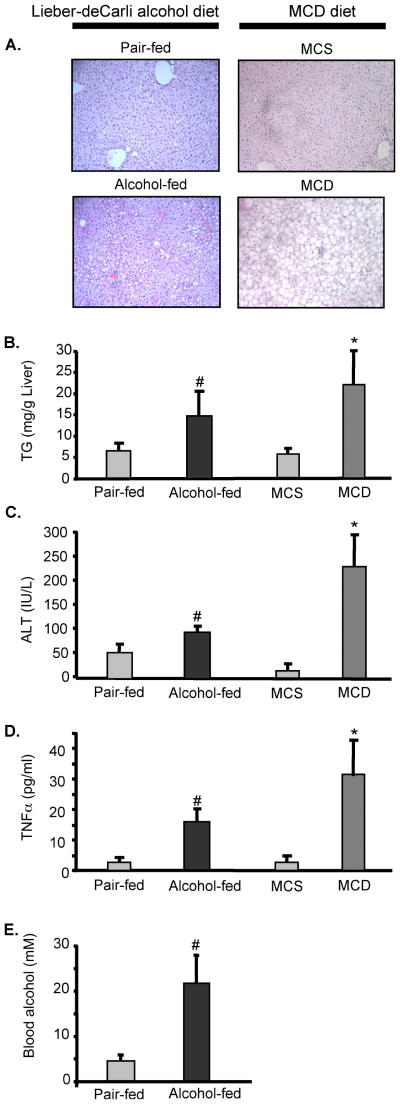
Methods: We fed Lieber-DeCarli alcohol or methionine-choline-deficient (MCD) diets to C57Bl6 and analyzed livers for histopathology, cytokines by ELISA, alanine aminotransferase (ALT) by biochemical assay, and microRNA profile by microarray.
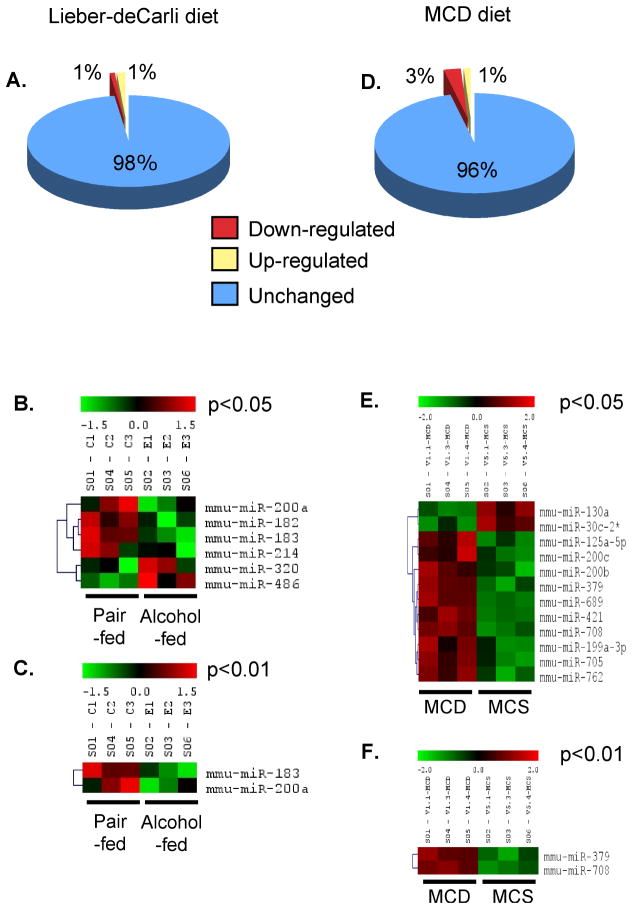
Results: Both Lieber-DeCarli and MCD diets lead to development of liver steatosis, liver injury, indicated by increased ALT, and elevated levels of serum TNFalpha, suggesting that animal models portray the pathophysiological features of alcoholic and nonalcoholic fatty liver, respectively. We identified that Lieber-deCarli diet up-regulated 1% and down-regulated 1% of known miRNA; MCD diet up-regulated 3% and down-regulated 1% of known miRNA, compared to controls. Of miRNAs that changed expression levels, 5 miRNAs were common in alcoholic and nonalcoholic fatty livers: the expression of both miR-705 and miR-1224 was increased after Lieber-DeCarli or MCD diet feeding. In contrast, miR-182, miR-183, and miR-199a-3p were down-regulated in Lieber-deCarli feeding, while MCD diet lead to their up-regulation, compared to corresponding controls.
Conclusions: Our findings indicate etiology-specific changes in miRNA expression profile during steatohepatitis models, which opens new avenues for research in the pathophysiology of alcoholic and nonalcoholic fatty liver disease.
Figures
References
-
- Ambros V. The functions of animal microRNAs. Nature. 2004;431:350–355. - PubMed
-
- Barbarotto E, Calin GA. Potential therapeutic applications of miRNA-based technology in hematological malignancies. Curr Pharm Des. 2008;14(21):2040–2050. - PubMed
-
- Bhattacharyya SN, Habermacher R, Martine U, Closs EI, Filipowicz W. Relief of microRNA-mediated translational repression in human cells subjected to stress. Cell. 2006;125:1111–1124. - PubMed
-
- Bruchova H, Merkerova M, Prchal JT. Aberrant expression of microRNA in polycythemia vera. Haematologica. 2008;93(7):1009–1016. - PubMed
Publication types
MeSH terms
Substances
Grants and funding
LinkOut - more resources
Full Text Sources
Other Literature Sources
Medical
