. 2009 Nov 1;48(2):362-70.
doi: 10.1016/j.neuroimage.2009.06.059. Epub 2009 Jun 30.

Quantitation of cannabinoid CB1 receptors in healthy human brain using positron emission tomography and an inverse agonist radioligand

Affiliations

Quantitation of cannabinoid CB1 receptors in healthy human brain using positron emission tomography and an inverse agonist radioligand

Garth E Terry et al. Neuroimage. .

Abstract

[11C]MePPEP is a high affinity, CB1 receptor-selective, inverse agonist that has been studied in rodents and monkeys. We examined the ability of [11C]MePPEP to quantify CB1 receptors in human brain as distribution volume calculated with the "gold standard" method of compartmental modeling and compared results with the simple measure of brain uptake. A total of 17 healthy subjects participated in 26 positron emission tomography (PET) scans, with 8 having two PET scans to assess retest variability. After injection of [11C]MePPEP, brain uptake of radioactivity was high (e.g., 3.6 SUV in putamen at approximately 60 min) and washed out very slowly. A two-tissue compartment model yielded values of distribution volume (which is proportional to receptor density) that were both well identified (SE 5%) and stable between 60 and 210 min. The simple measure of brain uptake (average concentration of radioactivity between 40 and 80 min) had good retest variability ( approximately 8%) and moderate intersubject variability (16%, coefficient of variation). In contrast, distribution volume had two-fold greater retest variability ( approximately 15%) and, thus, less precision. In addition, distribution volume had three-fold greater intersubject variability ( approximately 52%). The decreased precision of distribution volume compared to brain uptake was likely due to the slow washout of radioactivity from brain and to noise in measurements of the low concentrations of [11C]MePPEP in plasma. These results suggest that brain uptake can be used for within subject studies (e.g., to measure receptor occupancy by medications) but that distribution volume remains the gold standard for accurate measurements between groups.


Figures

FIGURE 1
FIGURE 1
[11C]MePPEP in human brain. PET images from 40 to 80 minutes after injection of [11C]MePPEP were averaged (left column) and coregistered to the subject’s MRI (middle column). PET and MR images are overlaid in the right column.
FIGURE 2
FIGURE 2
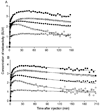
Time-activity curves of [11C]MePPEP in brain from different subjects scanned for (A) 150 minutes and (B) 210 minutes. Decay-corrected measurements from the putamen (■), prefrontal cortex (□), cerebellum (●), pons (○), and white matter (x) were fitted with an unconstrained 2-tissue compartment model (−). Putamen was consistently the region of highest brain uptake. White matter was consistently the region of lowest brain uptake, followed by pons. Concentration is expressed as standardized uptake value (SUV), which normalizes for injected activity and body weight.
FIGURE 3
FIGURE 3
Concentration of [11C]MePPEP and its percentage composition in arterial plasma. (A) Average concentration of [11C]MePPEP in arterial plasma from 17 subjects is plotted over time after injection. Data after the peak (about 1 minute) were fitted to a tri-exponential curve (―). Symbols (▲) and error bars represent mean and SD. (B) Percent composition of parent radioligand (●) and radiometabolites (○) in arterial plasma from 17 subjects are plotted over time after injection. After 60 minutes, [11C]MePPEP accounted for ≤ 15% of radioactivity in arterial plasma. (C) This radiochromatogram illustrates plasma composition from one subject, 30 minutes after injection of [11C]MePPEP. Radioactiivty was measured in counts per second (cps). Peaks are labeled with increasing lipophilicity from A to F. Peak E represents [11C]MePPEP.
FIGURE 3
FIGURE 3
Concentration of [11C]MePPEP and its percentage composition in arterial plasma. (A) Average concentration of [11C]MePPEP in arterial plasma from 17 subjects is plotted over time after injection. Data after the peak (about 1 minute) were fitted to a tri-exponential curve (―). Symbols (▲) and error bars represent mean and SD. (B) Percent composition of parent radioligand (●) and radiometabolites (○) in arterial plasma from 17 subjects are plotted over time after injection. After 60 minutes, [11C]MePPEP accounted for ≤ 15% of radioactivity in arterial plasma. (C) This radiochromatogram illustrates plasma composition from one subject, 30 minutes after injection of [11C]MePPEP. Radioactiivty was measured in counts per second (cps). Peaks are labeled with increasing lipophilicity from A to F. Peak E represents [11C]MePPEP.
FIGURE 4
FIGURE 4
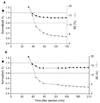
Value of distribution volume (VT) and its identifiability as function of duration of image acquisition for putamen, a high binding region. VT (■) was calculated using an unconstrained two-tissue compartment model with increasingly truncated acquisition times. Values are normalized to the value attained with 150 minutes of imaging and are plotted with the y-axis on left. The corresponding SE (○), which is inversely proportional to identifiability, is plotted with the y-axis on right. (A) The points represent an average of 15 subjects scanned for a total of 150 minutes. Two subjects scanned for only 150 minutes had a slow washout, and did not have stable measurements of VT until 120 minutes. (B) The points represent an average of 10 subjects scanned for a total of 210 minutes. Other brain regions demonstrated similar or better stability over time.
FIGURE 5
FIGURE 5
Simulated changes in brain uptake with variations of receptor density. The average individual kinetic parameters from the prefrontal cortex were used to simulate expected changes in brain uptake from 40 – 80 (○), 0 – 210 (●), and 150 – 180 (□) minutes. Changes in receptor density were simulated by varying the value of k3 from its mean value (set at 100% on the x-axis). As expected, the value of VT (shown by a line which has a y-intercept equal to K1/k2) is directly proportional to changes in k3.

Similar articles

Cited by

References

    1. Abood ME, Ditto KE, Noel MA, Showalter VM, Tao Q. Isolation and expression of a mouse CB1 cannabinoid receptor gene. Comparison of binding properties with those of native CB1 receptors in mouse brain and N18TG2 neuroblastoma cells. Biochem. Pharmacol. 1997;53:207–214. - PubMed
    1. Akaike H. A new look at the statistical model identification. IEEE Trans Automat Contr AC. 1974;19:716–723.
    1. Bevington PR, Robinson DK. Data reduction and error analysis for the physical sciences. New York: McGraw-Hill; 2003.
    1. Burger C, Mikolajczyk K, Grodzki M, Rudnicki P, Szabatin M, Buck A. JAVA tools quantitative post-processing of brain PET data. J Nucl Med. 1998;39 Suppl.:277P.
    1. Burns HD, Van Laere K, Sanabria-Bohorquez S, Hamill TG, Bormans G, Eng WS, Gibson R, Ryan C, Connolly B, Patel S, Krause S, Vanko A, Van Hecken A, Dupont P, De Lepeleire I, Rothenberg P, Stoch SA, Cote J, Hagmann WK, Jewell JP, Lin LS, Liu P, Goulet MT, Gottesdiener K, Wagner JA, de Hoon J, Mortelmans L, Fong TM, Hargreaves RJ. [18F]MK-9470, a positron emission tomography (PET) tracer for in vivo human PET brain imaging of the cannabinoid-1 receptor. Proc Natl Acad Sci U.S.A. 2007;104(23):9800–9805. - PMC - PubMed

Publication types

Substances

LinkOut - more resources